
Ashtead Technology vs. Oceaneering Inc: The Quality Offshore Services Showdown
Exploring Capital Discipline in Subsea and Engineered Solutions for Energy Markets

Welcome to Compound & Fire, where we’re on a mission to build wealth the smart way. Hunting for top-quality businesses that grow shareholder value over the long haul, paving the road to financial freedom and early retirement.
This community is free! Let’s grow this journey together. Join the conversation on our Global Quality Investing Discord App and subscribe to my Substack for free if you haven’t yet!
Hello, fellow quality investors!
In the volatile world of offshore energy services, where cyclical booms and busts test even the steeliest balance sheets, two players stand out for their focus on subsea expertise: Ashtead Technology Holdings plc (AT.L) and Oceaneering International, Inc. (OII). Both cater to the global offshore energy sector. Ashtead through equipment rentals and tech-driven solutions, Oceaneering via engineered services and robotics, but they diverge sharply in scale, margins, and growth trajectories. A big thanks to Discord member Wayne of Dragon Field for spotlighting Ashtead Technology in this Quick Scan. As oil prices stabilize above $70/bbl and decommissioning demands rise, we’re pitting these names head-to-head using our proprietary Quick Scan framework. Which one flags as a candidate for in-depth quality analysis? Let’s dive in.
Quick Scan Overview: Investment Readiness Scores
Before I declare a winner, let's recap our Investment Readiness Score (IRS) methodology. This proprietary framework assesses companies across three key areas: Financial Health & Performance (e.g., debt levels, margins, ROIC), Shareholder Value & Suitability (e.g., management ownership, stock-based compensation), and Growth Metrics (e.g., revenue CAGR). Scores are normalized out of 100 per metric, with an overall IRS above 80 signaling a strong candidate for further due diligence. I use data from the latest available annual reports.
Ashtead Technology: Quick Scan
For a better picture of the Quick Scan click here. The calculation of the IRS score is available in our Discord app
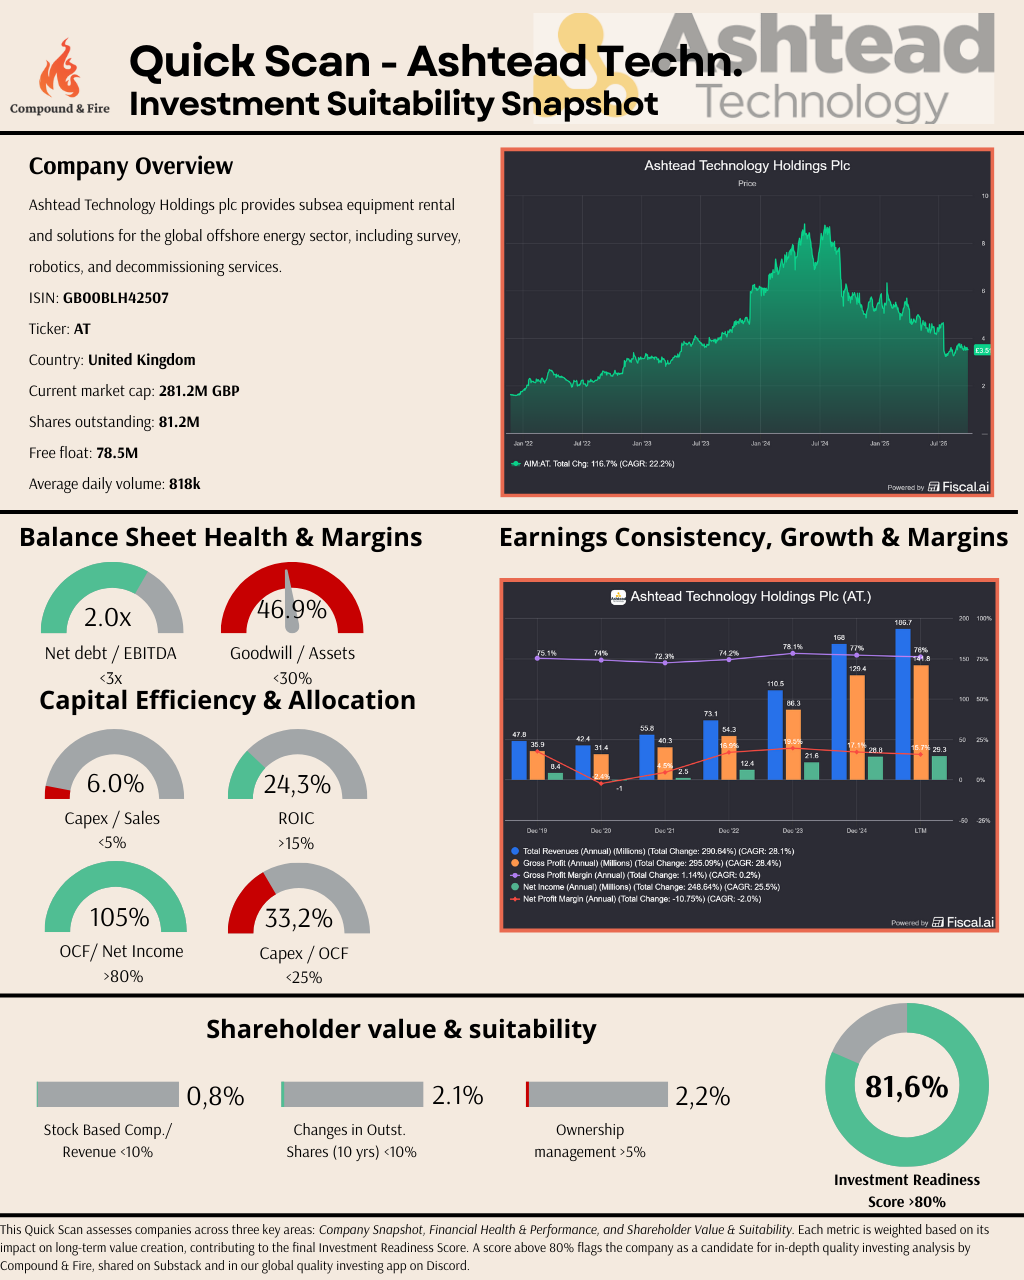
Summary and Highlights: Ashtead Technology Holdings PLC (AT.L) is a pure-play subsea speciality equipment rental company serving the offshore energy industries, primarily the traditional oil and gas (O&G) and more recently, the offshore wind farms. It operates as the largest subsea equipment rental and solutions provider supporting the Installation, Inspection, Maintenance, and Repair (IMR) and decommissioning of offshore energy infrastructure across the globe. Headquartered in the UK, Ashtead Technology supports customers from 15 strategically located customer service hubs globally.
Ashtead Technology trades in the AIM market of the London Stock Exchange under the ticker AT.L, and will move to the main exchange on October 6, 2025, to improve its liquidity and provide more access to international investors. Its current market cap is £286 Million and 81 million shares outstanding, with an average daily volume of 1.0 million as of September 2025. Its Investment Readiness Score (IRS) of 81.6 reflects excellent margins, high revenue growth, and very good return on invested capital. Since its November 2021 IPO, AT.L stock has appreciated 103%, and a total return of 21% CAGR including dividend for its shareholders.
Net Debt / EBITDA: 2.0 (86.9/100) – Reasonable debt level for an equipment rental business with ample ability to generate free cash flow.
Intangibles / Assets: 46.9% (57.4/100) – High ratio reflects high level of M&A activities to consolidate the highly fragmented niche industry.
Capex / Sales: 6.0% (77.8/100) – Consider capital light for an equipment rental business with relatively low reinvestment needs. Note that we have excluded the growth capex and considered the maintenance capex shared by management to be ~10M GBP. Although we have used this number, it might be at the low end as their Depreciation figure was ~19M.
Return on Invested Capital: 24.3% (92.4/100) – Respectable ROIC reflects excellent capital allocation skills of management.
OCF / Net Income: 105% (86.2/100) – Strong cash conversion, exceeding earnings.
Gross Margin: 77.0% (92.3/100) – Excellent margins for an equipment rental business.
Net Profit Margin: 17.1% (80.9/100) – High margin due to specialty and niche focus.
Revenue 5YR CAGR: 28.3% (95.5/100) – Excellent growth since IPO, but with shorter history.
SBC / Revenue: 0.8% (96.8/100) – Minimal dilution of shares.
Changes in Outstanding Shares: 2.09% (95.8/150) – Minor share dilution.
Ownership Management: 2.2% (35.4/100) – Low level of insider ownership, but the recent board members’ open market purchase is a positive sign.
Oceaneering International Inc.: Quick Scan
For a better picture of the Quick Scan click here. The calculation of the IRS score is available in our Discord app
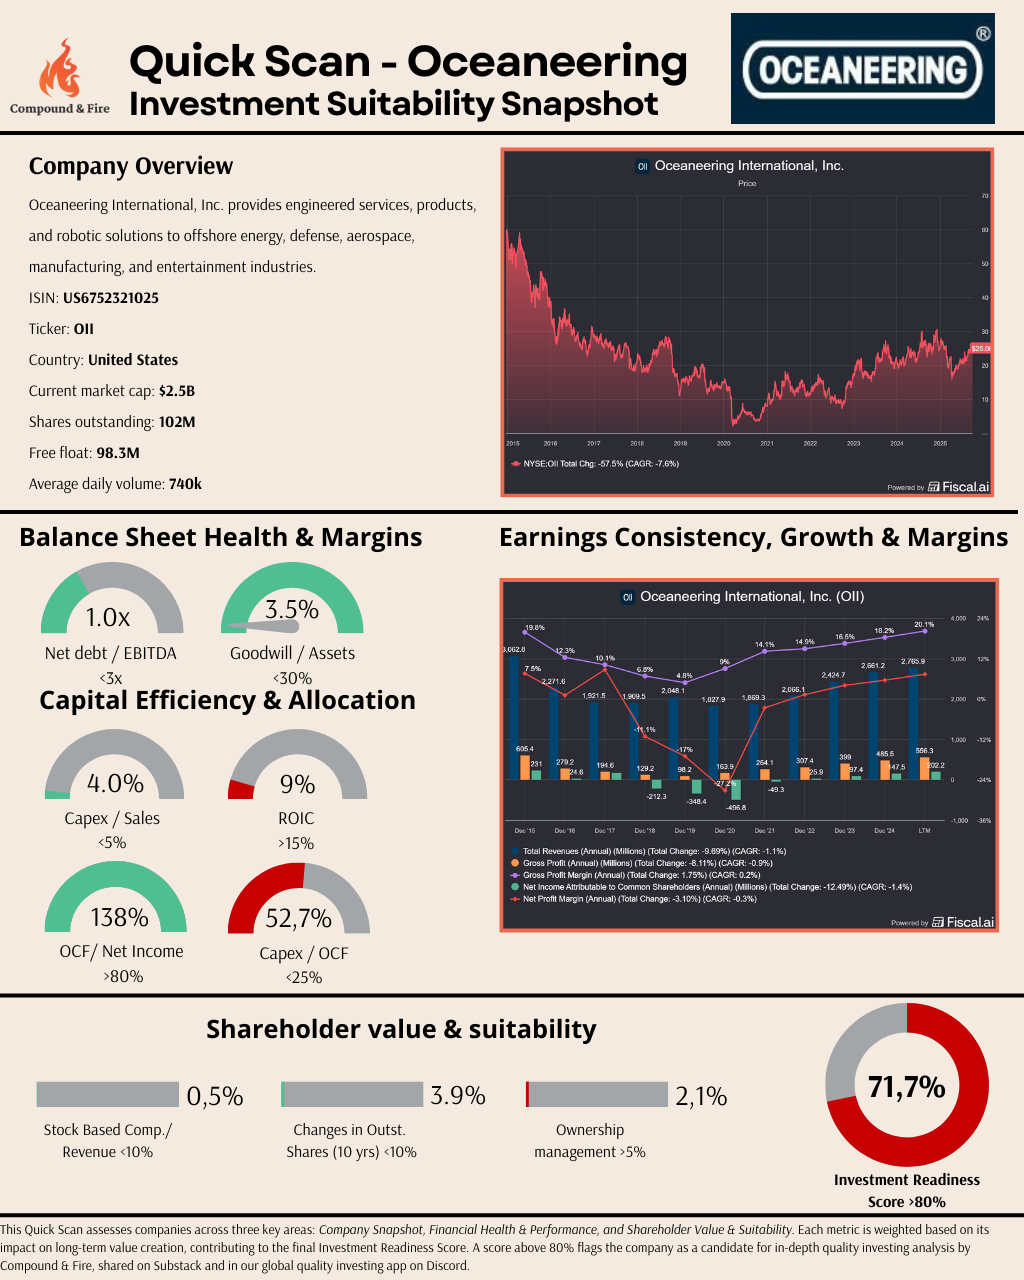
Summary and Highlights: It is difficult to find a direct competitor of Ashtead Technology for head-to-head comparison, since two of its major competitors, STR Subsea and Unique Group, are privately held companies. We selected Oceaneering International (NYSE:OII) as a peer to compare because it’s one of the largest underwater services contractors in the world, and its largest business unit, the Subsea Robotics, has a lot of similarities with Ashtead Technology especially in the offshore O&G service segment. One critical distinction between AT and OII is that AT focuses on renting out their subsea speciality equipment and playing a support role in offshore project execution, while OII deploys its own equipment to perform services directly. Headquartered in Houston, Texas, Oceaneering has major operations in North America (42% of total revenue in 2024) and others are in Africa, UK, Norway, Brazil, Asia, and Australia. With a market cap of $2.5 billion and 102 million shares outstanding, Oceaneering is traded on the New York Stock (NYSE). Its Investment Readiness Score (IRS) of 71.7 reflects the lower gross margins and return on invested capital. Oceaneering’s stock performance has a strong correlation with offshore CapEx cycle. For example, during the last strong offshore CapEx cycle from 2005 to 2013, Oceaneering stock returned 842% including dividend, or a CAGR of 28.9%, but it gave back 96.7% during the downturn from 2013 to 2020.
Net Debt / EBITDA: 1.0 (93.6/100) – Fairly low level of debt level for an offshore service company with ample free cash flow generation capacity in the current upcycle.
Intangibles / Assets: 3.5% (97.6/100) – Very low level of goodwill and intangibles.
Capex / Sales: 4.0% (83.9/100) – Consider capital light for an offshore service contractor, with the numerical score not that high.
Return on Invested Capital: 9.0% (47.8/100) – ROIC below the threshold of 15%.
OCF / Net Income: 138% (94.6/100) – Strong cash conversion, exceeding earnings.
Gross Margin: 18.2% (36.5/100) – Low absolute value, but typical for this kind of business.
Net Profit Margin: 5.5% (29.6/100) – Low margin reflects the tepid nature of the current offshore CapEx upcycle.
Revenue 10YR CAGR: 5.7% (80.5/100) – Low because the current 10-yr period spans 6 years of downcycle (2016-2020) and 4 years of tepid upcycle (2021-2025).
SBC / Revenue: 0.5% (98.1/100) – Minor dilution of shares.
Changes in Outstanding Shares: 3.89% (92.2/150) – Small change in outstanding shares.
Ownership Management: 2.1% (34/100) – Low level of management ownership is a negative.
The Big Picture: Investment Readiness Check
Head-to-head, Ashtead pulls ahead in growth and profitability, leveraging its focused rental model for sticky, high-margin revenue in subsea decommissioning. A tailwind as North Sea fields mature. Oceaneering’s diversification buffers cycles, but its broader scope dilutes ROIC and margins, yielding a more “value-trap” vibe despite lower debt. Both exhibit capital discipline (low capex, strong OCF), but Ashtead’s 24% ROIC vs. 9% underscores superior allocation. Shareholder alignment is comparable, with neither diluting aggressively. At current levels, Ashtead’s 82% readiness score flags it for quality screens, while Oceaneering’s 72% suits cyclical recovery bets.
What’s the Verdict?
For quality investors, Ashtead’s margin moat and growth engine make it the offshore pick of the two, poised for upside if energy capex holds. Oceaneering offers stability but lacks the punch for long-term compounding. Both warrant watches, but Ashtead earns the deeper dive, with Wayne leading the charge on that front. Expect a deep dive later this year.
Winner: Ashtead Technology
But is the market telling a different story? Let’s explore.
Market Reality Check: FCF Yield
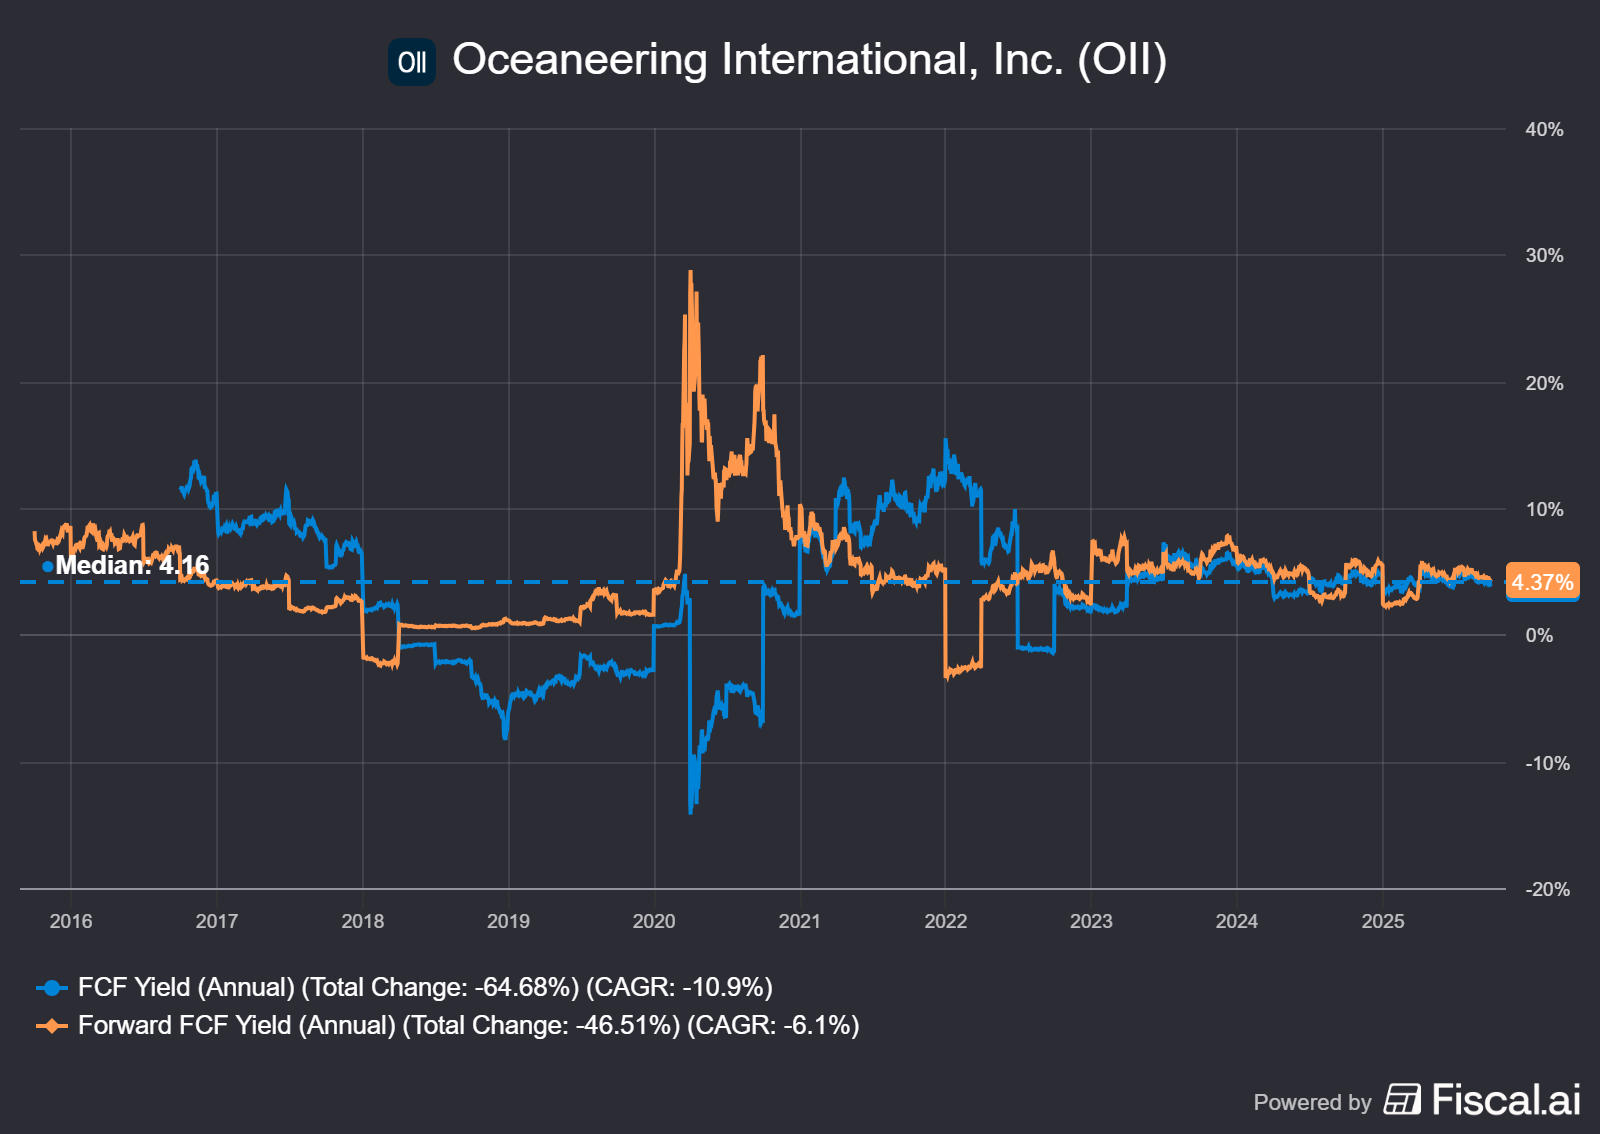
To ground this in valuations, let's examine Free Cash Flow (FCF) yields as of mid-2025, incorporating the latest charts from Fiscal.ai for a visual and quantitative perspective. These charts illustrate the annual FCF yield trends, highlighting volatility, medians, and cumulative growth, which is key for assessing if these compounders are priced attractively amid market fluctuations.
For Ashtead Technology, the FCF yield chart shows a volatile path between 0-8% in recent years, with a median of 2.2% and a current yield of 2.8%.
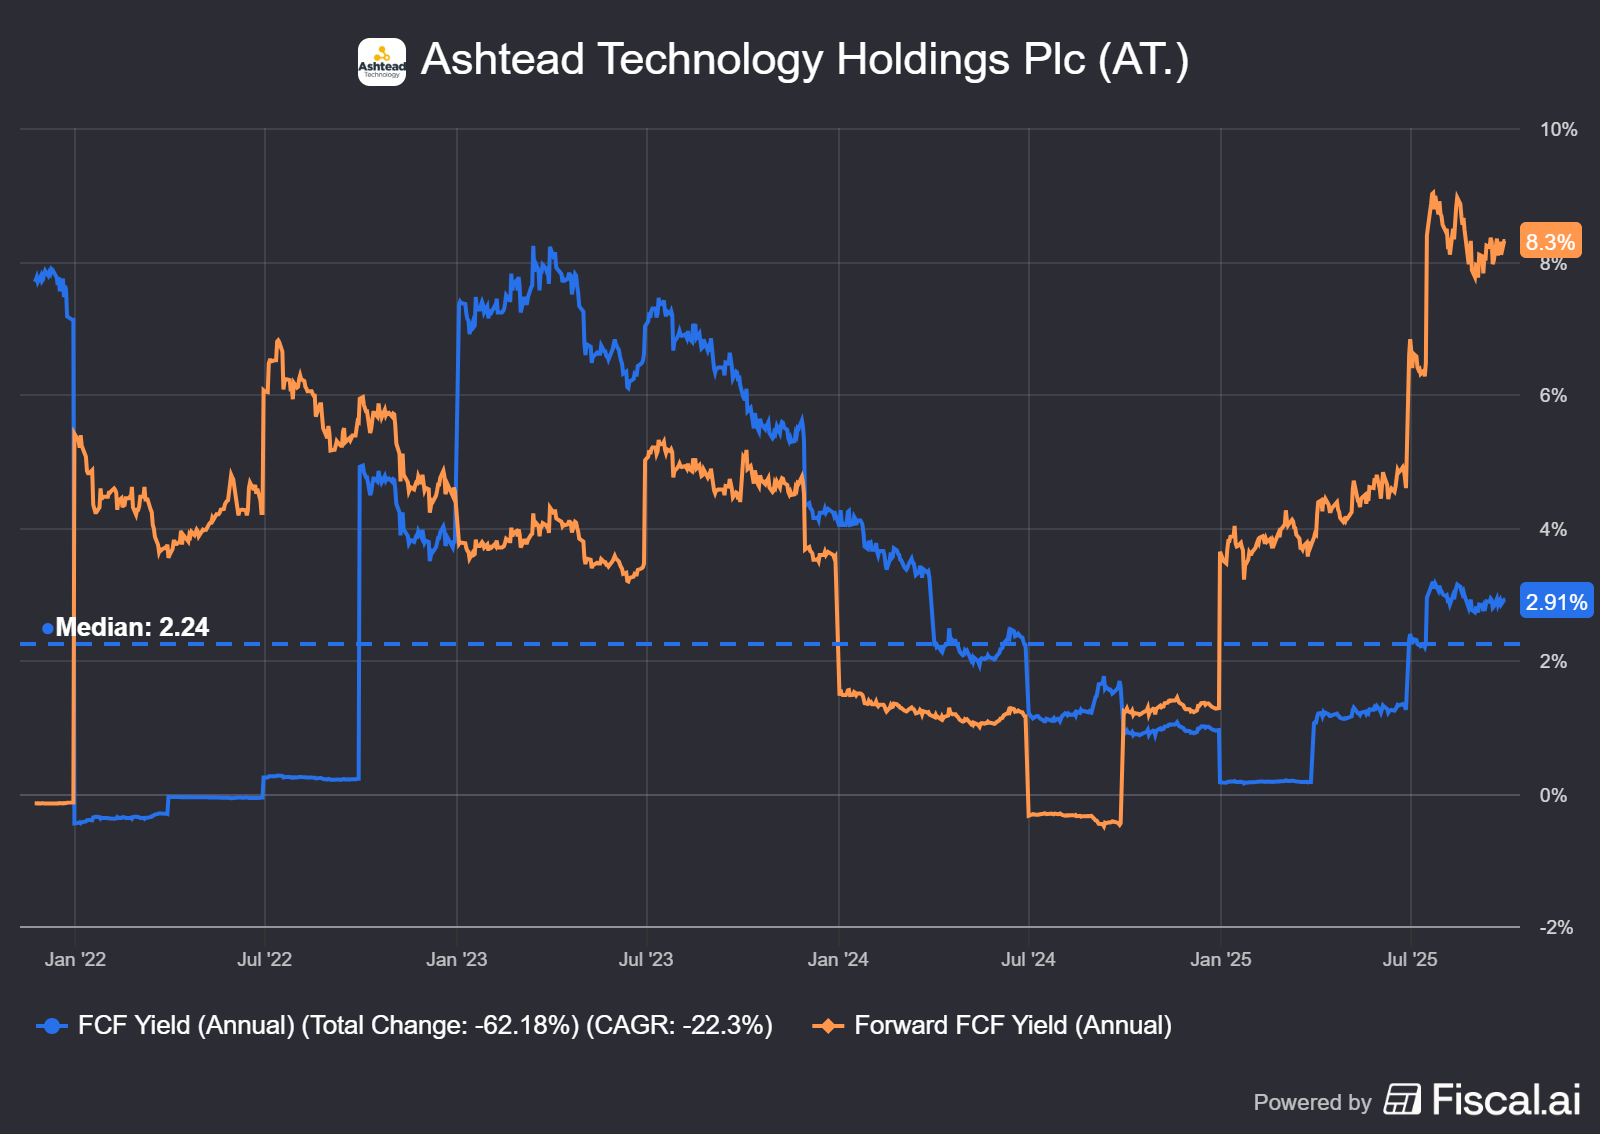
However, looking at Forward Free Cash Flow Yield it gives a value of 8.3%, which looks much more interesting.
For Oceaneering, the chart depicts sharper swings between -15 and +15% and mre stable recently around 3-6% % with a median of 4.2% and a current yield of roughly 4.0%.
Ashtead Technologies offers a Forward FCF yield above the 10-year government bond yield of ~4.5%, implying it may be valued at an attractive level.
For Oceaneering the Quick Scan just showed it doesn’t meet the Investment Readiness Score. Ashtead Technologies does, but a deep dive is needed to understand the potential shareholders return for the company.
Hopefully you have enjoyed this quick scan battle. Share your thoughts in the comments below or join the debate on my Global Quality Investing Discord.
Join the Quality Edge!
Stay tuned for adetailed report on Substack and my Global Quality Investing Discord. The fintech space offers rich opportunities, and Wise stands out as a leader worth watching. Until next time, keep compounding!
Share this article
If you enjoyed reading my article, feel free to share it with friends:
Disclaimer
The information in this article is provided for informational and educational purposes only.
The information is not intended to be and does not constitute financial advice or any other advice, is general in nature, and is not specific to you. Before using this article’s information to make an investment decision, you should seek the advice of a qualified and registered securities professional and undertake your own due diligence.
None of the information in this article is intended as investment advice, as an offer or solicitation of an offer to buy or sell, or as a recommendation, endorsement, or sponsorship of any security, company, or fund. The author is not responsible for any investment decision made by you. You are responsible for your own investment research and investment decisions.