


Insurance Brokerage Showdown: Brown & Brown vs. Arthur J. Gallagher—Who Wins the Quality Battle?
A Quick Scan into Financial Health, Efficiency, and Profitability in the Ultimate Brokerage Face-Off

Welcome to Compound & Fire, where we’re on a mission to build wealth the smart way—hunting for top-quality businesses that grow shareholder value over the long haul, paving the road to financial freedom and early retirement.
This community is free, but if you’re enjoying the deep dives and want to support more content, you can treat me to a coffee on Buy Me a Coffee. Every bit helps keep the fire burning, and I’m truly grateful for your support! Let’s grow this journey together—join the conversation on our Global Quality Investing Discord App and subscribe to my Substack for free if you haven’t yet!
Hello, fellow quality investors!
In the competitive world of insurance brokerage, Brown & Brown, Inc. (BRO) and Arthur J. Gallagher & Co. (AJG) stand as titans, serving commercial and individual clients with risk management and insurance solutions. Both have earned high marks in our Compound & Fire quick scans, passing the Investment Readiness Score (IRS) threshold of 80%—a signal of their potential for long-term quality investing. I previously shared AJG’s quick scan, which scored a strong 82.7%. Now, I’m excited to introduce a fresh quick scan for BRO, hot off the press, scoring 81.9%. But which firm truly deserves the crown? In this head-to-head battle, we’ll compare their financial health, capital efficiency, and shareholder value metrics to determine the winner. Spoiler alert: AJG takes the lead, but it’s a close call. Let’s dive into the numbers and see why.
Introducing the Brown & Brown Quick Scan
Before we jump into the battle, let’s take a closer look at Brown & Brown’s newly minted quick scan. This snapshot evaluates BRO across three key areas—company overview, financial health and performance, and shareholder value and suitability—assigning an overall IRS to gauge its fit for quality investing. With metrics like a Net Debt/EBITDA of 2.1x, Goodwill/Assets at 48.4%, and an OCF/Net Income ratio of 131.1%, BRO’s profile offers plenty to unpack. Check out the full quick scan below to see how it stacks up.

This Quick Scan is shared and available in our Discord app
Round 1: Financial Health—Debt and Goodwill Under the Spotlight
A strong balance sheet is crucial for quality companies, especially in a capital-intensive industry like insurance brokerage where acquisitions drive growth. Brown & Brown carries a Net Debt/EBITDA ratio of 2.1x, slightly better than the ideal threshold of <3x, indicating manageable but notable leverage. More concerning is its Goodwill/Assets ratio of 48.4%, well above the desired <30%. High goodwill often signals aggressive acquisition activity, potentially overpaying for assets, which can weigh on the balance sheet if those acquisitions underperform.
Arthur J. Gallagher, as shared in its earlier quick scan, shows a much stronger profile. Its Net Debt/EBITDA is an impressive -0.4x, meaning it holds more cash than debt—a rare and enviable position. Its Goodwill/Assets ratio, at 19.1%, is also well within the desired <30%, suggesting a disciplined approach to acquisitions. AJG’s lower goodwill relative to assets indicates it may have paid reasonable premiums for acquisitions or funded them sustainably. AJG often uses equity to finance deals, as evidenced by its 28.1% increase in outstanding shares over 10 years, which reduces debt burdens and keeps goodwill in check, unlike debt-heavy acquisitions that can inflate goodwill and interest expenses.
Winner: AJG—negative net debt and low goodwill ratios signal a far more resilient balance sheet.
Round 2: Capital Efficiency—Cash Flow Tells the Story
Capital efficiency measures how well a company converts revenue and earnings into cash flow and returns. At first glance, Brown & Brown appears strong with an ROE of 21.9%, which could suggest superior capital allocation compared to Arthur J. Gallagher’s Adjusted ROE of 15.9%. However, ROE must be contextualized. BRO’s higher ROE is partly driven by its leverage (Net Debt/EBITDA of 2.1x), which amplifies returns but also increases risk, especially in a downturn. Digging deeper, BRO’s OCF/Net Income ratio is 131.1%, indicating solid cash generation relative to reported earnings, but it lags behind AJG. Its Capex/Sales ratio of 1.7% and Capex/OCF of 7% reflect efficient capital spending, yet these metrics don’t fully offset the risks tied to its debt-driven ROE.
Arthur J. Gallagher, while showing a lower ROE, achieves its 15.9% with virtually no debt (Net Debt/EBITDA of -0.4x), making its returns more sustainable and less reliant on financial engineering. AJG’s OCF/Net Income ratio is a standout at 176%, far surpassing BRO’s 131.1%, demonstrating exceptional cash flow conversion—a critical factor for funding growth organically. Its Capex/Sales and Capex/OCF are also slightly better than BRO’s, reflecting tighter capital discipline. While BRO’s higher ROE is impressive, AJG’s combination of debt-free returns, superior cash flow efficiency, and lower capital expenditure gives it the edge in overall capital efficiency for long-term quality investing.
Winner: AJG—sustainable returns, better cash flow conversion, and tighter capital discipline outweigh BRO’s leverage-driven ROE.
Round 3: Shareholder Value—Growth and Ownership
Both companies score well on shareholder value, but key differences emerge. Brown & Brown’s stock-based compensation/revenue is 2.1%, and its outstanding shares have decreased by 0.1% over 10 years, showing discipline in share issuance. Ownership by management is strong at 16.4%, aligning interests with shareholders. BRO’s growth is impressive, with a total revenue CAGR of 12.9% and a net income CAGR of 16.9%, reflecting robust performance.
Arthur J. Gallagher’s stock-based compensation/revenue is lower at 1.5%, a slight advantage, but it has increased outstanding shares by 28.1% over 10 years, reflecting its equity-funded acquisition strategy, which significantly dilutes shareholders. Management ownership is much lower at 1% (<5%), raising concerns about alignment with shareholder interests. On growth, AJG’s total revenue CAGR is 8.4%, lagging behind BRO’s 12.9%, due to its acquisition-heavy strategy, which takes time to scale. However, AJG’s net income CAGR of 17.0% slightly exceeds BRO’s 16.9%. More telling is AJG’s efficiency: for every 1% of revenue growth, AJG generates 2.02% net income growth (17.0% / 8.4%), compared to BRO’s 1.31% (16.9% / 12.9%). This indicates AJG’s superior margin expansion and operational efficiency, a critical factor for shareholder value in quality investing.
Winner: Tie—BRO’s strengths in revenue growth, minimal dilution, and ownership alignment ties AJG’s profitability efficiency and lower stock-based compensation.
The Final Verdict: AJG Sweeps the Battle
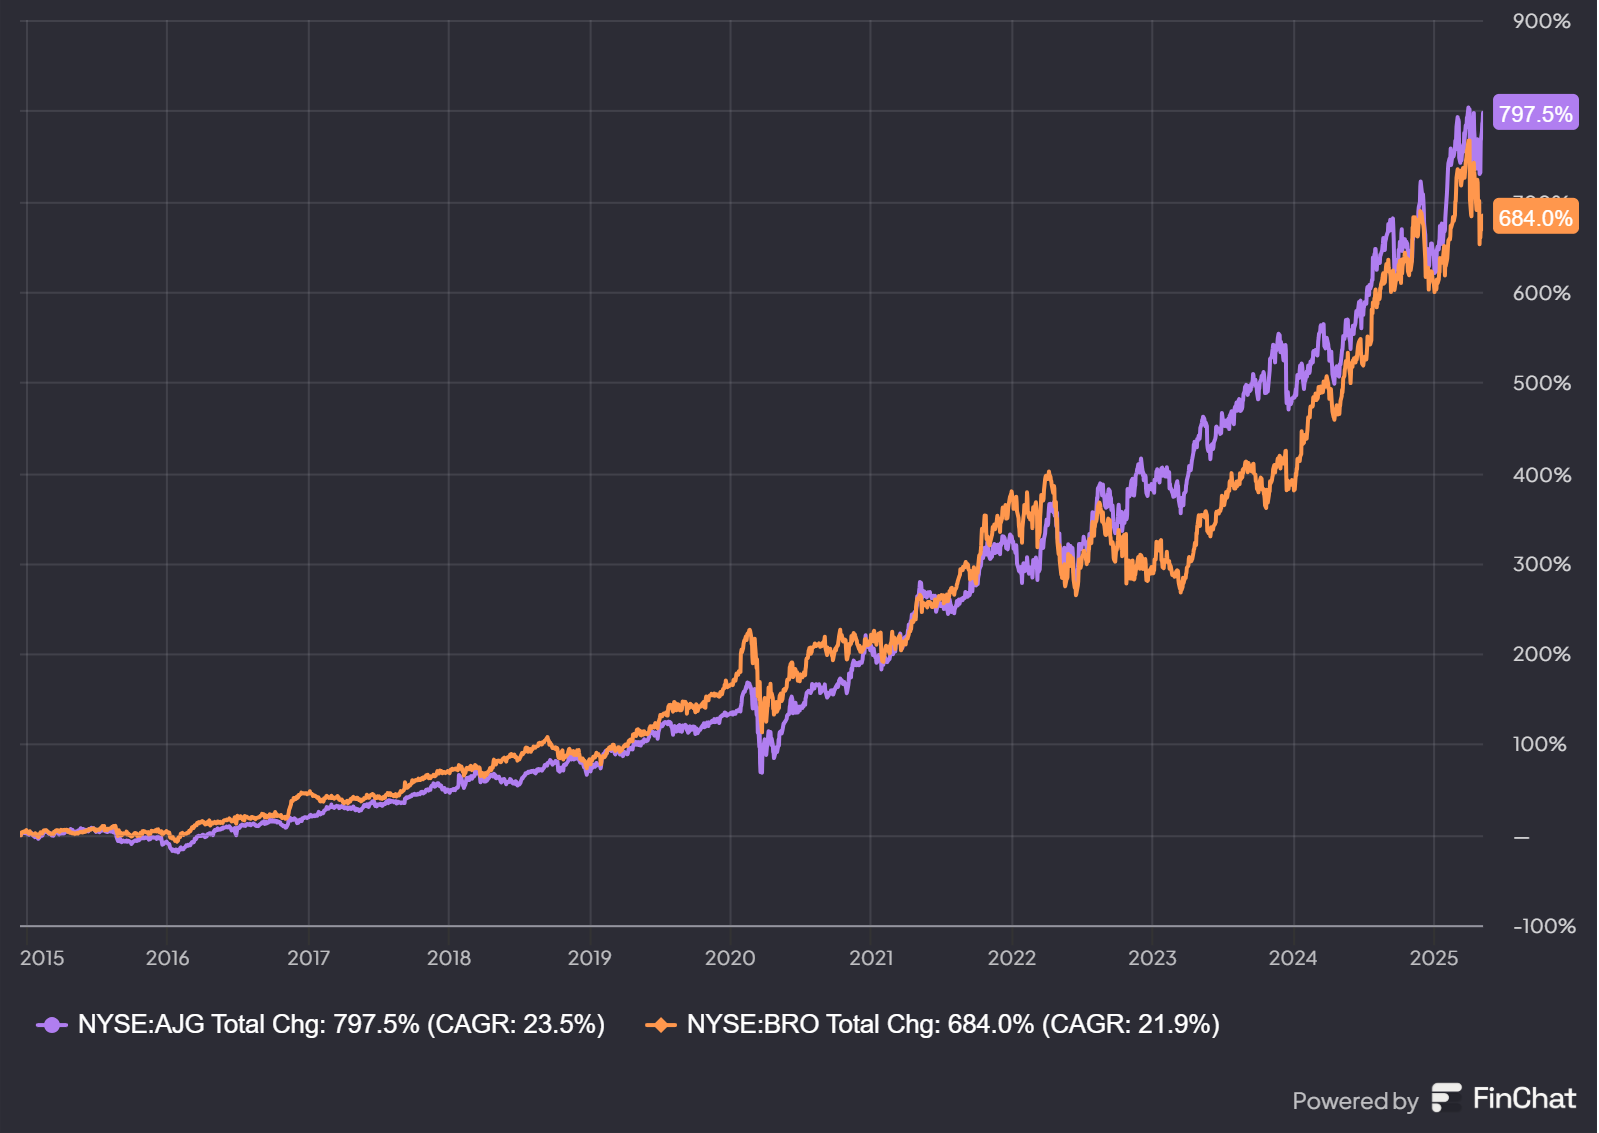
Brown & Brown is a quality player, with its new quick scan revealing an IRS of 80%, strong ROE, and robust revenue growth. However, it falls short in this battle. Arthur J. Gallagher, with an IRS of 82.7%, dominates all three rounds. Its debt-free balance sheet, exceptional cash flow conversion, disciplined acquisition strategy, and superior profitability efficiency make it the clear winner for quality investors. While BRO excels in minimal dilution and management ownership, AJG’s overall financial health, efficiency, and ability to grow profits more effectively secure its victory. AJG seems to be the safer, more efficient compounder for the long term. Probably the reason that the share price of AJG outperformed BRO the last 10 years:
If you’re enjoying these Quick Scans, consider subscribing to Compound & Fire for more quality investing insights:
And feel free to share this article with friends:
Disclaimer
The information in this article is provided for informational and educational purposes only.
The information is not intended to be and does not constitute financial advice or any other advice, is general in nature, and is not specific to you. Before using this article’s information to make an investment decision, you should seek the advice of a qualified and registered securities professional and undertake your own due diligence.
None of the information in this article is intended as investment advice, as an offer or solicitation of an offer to buy or sell, or as a recommendation, endorsement, or sponsorship of any security, company, or fund. The author is not responsible for any investment decision made by you. You are responsible for your own investment research and investment decisions.
You can't beat insurance companies.
They could go down if the general stock mkt goes down.
That's about it.
First