
Synopsys vs. Cadence Design Systems: EDA Titans Face Off
EDA Showdown: Which Semiconductor Design Leader Prevails in This Quality Battle?

Welcome to Compound & Fire, where we’re on a mission to build wealth the smart way—hunting for top-quality businesses that grow shareholder value over the long haul, paving the road to financial freedom and early retirement.
This community is free, but if you’re enjoying the deep dives and want to support more content, you can treat me to a coffee on Buy Me a Coffee. Every bit helps keep the fire burning, and I’m truly grateful for your support! Let’s grow this journey together—join the conversation on our Global Quality Investing Discord App and subscribe to my Substack for free if you haven’t yet!
Hello, fellow quality investors!
At Compound & Fire, I am on a mission to uncover the world’s best quality compounders—businesses that deliver consistent growth, robust financial health, and long-term shareholder value. Today, I am diving into a head-to-head battle in the electronic design automation (EDA) market: Synopsys, Inc. (SNPS) vs. Cadence Design Systems, Inc. (CDNS). These two industry giants provide the software, Intellectual Property, and services that power the design of cutting-edge semiconductor chips for AI, automotive, and more. But which one deserves a spot on my quality investing shortlist?
Quick Scan Overview: Investment Readiness Scores
I’ve run both companies through my proprietary Quick Scan, assessing them across three key areas: Company Snapshot, Financial Health & Performance, and Shareholder Value & Suitability. Each metric is weighted based on its impact on long-term value creation, contributing to a final Investment Readiness Score (IRS). A score above 80% flags a company as a candidate for in-depth quality investing analysis, shared on Substack and in our global quality investing app on Discord.
Let’s break down the quick scans, compare the results, and declare a winner.
Quick Scan Overview: Synopsys, Inc. (SNPS)
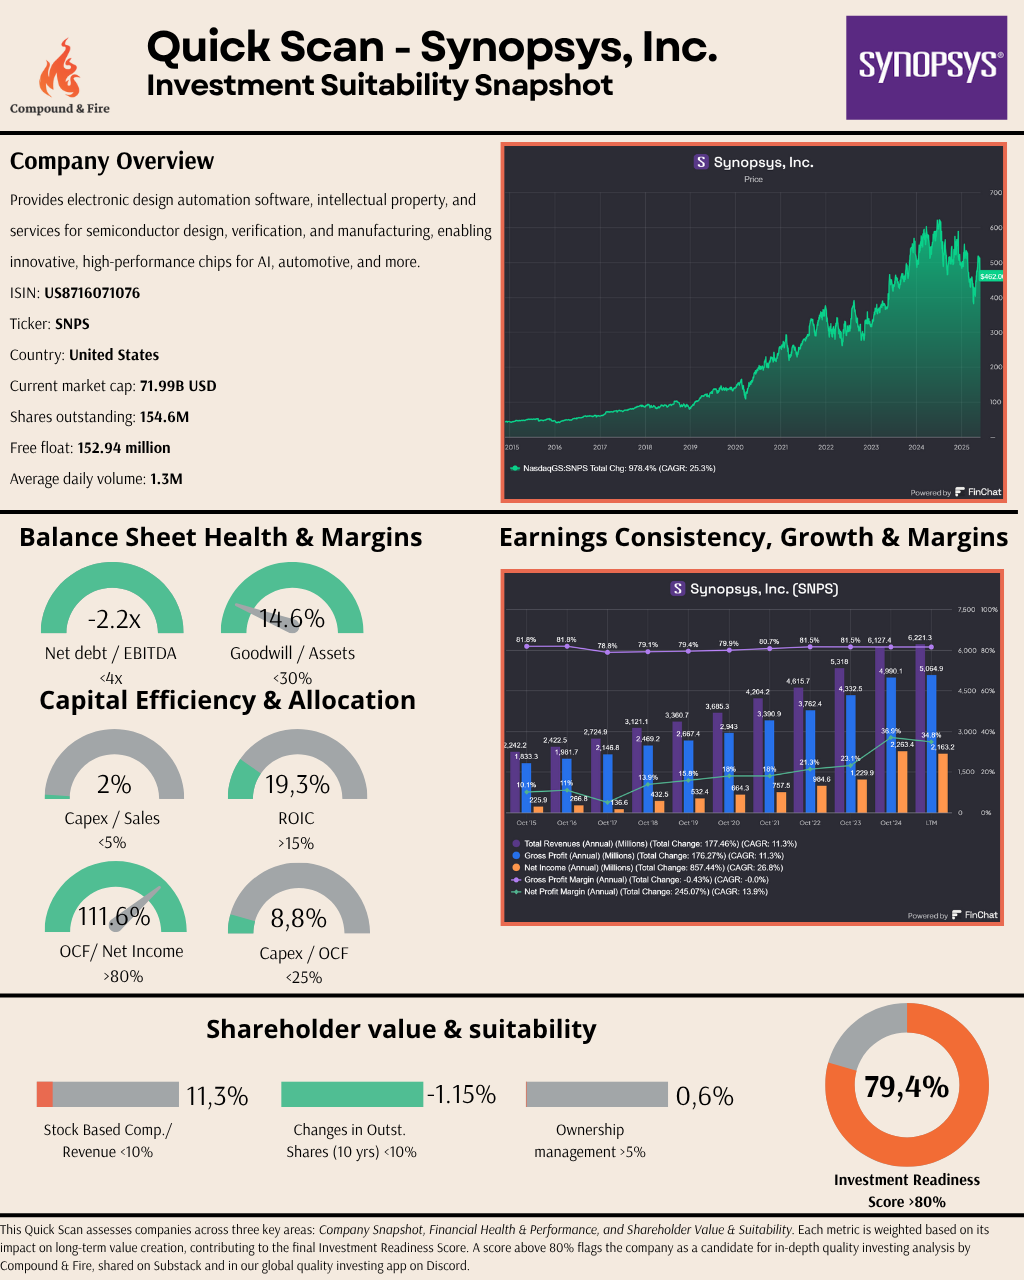
Synopsys has long been a leader in the EDA space, providing electronic design automation software, intellectual property, and services for semiconductor design, verification, and manufacturing.
Here’s how Synopsys performed in our Quick Scan:
Investment Readiness Score: 79.4% (just below the 80% threshold)
Balance Sheet Health: Net Debt/EBITDA at -2.2x, indicating a strong net cash position.
Growth: Revenue 10-Year CAGR of 11.3%, reflecting steady growth.
Profitability: Gross margin at 81.4%, net margin at 22.0%—very sound margins.
ROIC: 19.3%, well above the 15% quality threshold
Stock-Based Compensation: 11.3%, which I like to see at a lower level, but not very strange in their industry.
Ownership by management: 0.6%, well below the 5% I would like to see as a minimum.
This Quick Scan and the calculation of the IRS score is available in our Discord app
Synopsys shows strong financial health with a pristine balance sheet (negative net debt) and excellent cash conversion (OCF/Net Income at 111.6%). Its ROIC of 19.3% reflects efficient capital use, and the company has modestly reduced its share count over the past decade. However, a high stock-based compensation (11.3% of revenue) and low management ownership (0.6%) weigh on its shareholder alignment metrics, leaving it just shy of my 80% IRS threshold.
Quick Scan Overview: Cadence Design Systems, Inc. (CDNS)
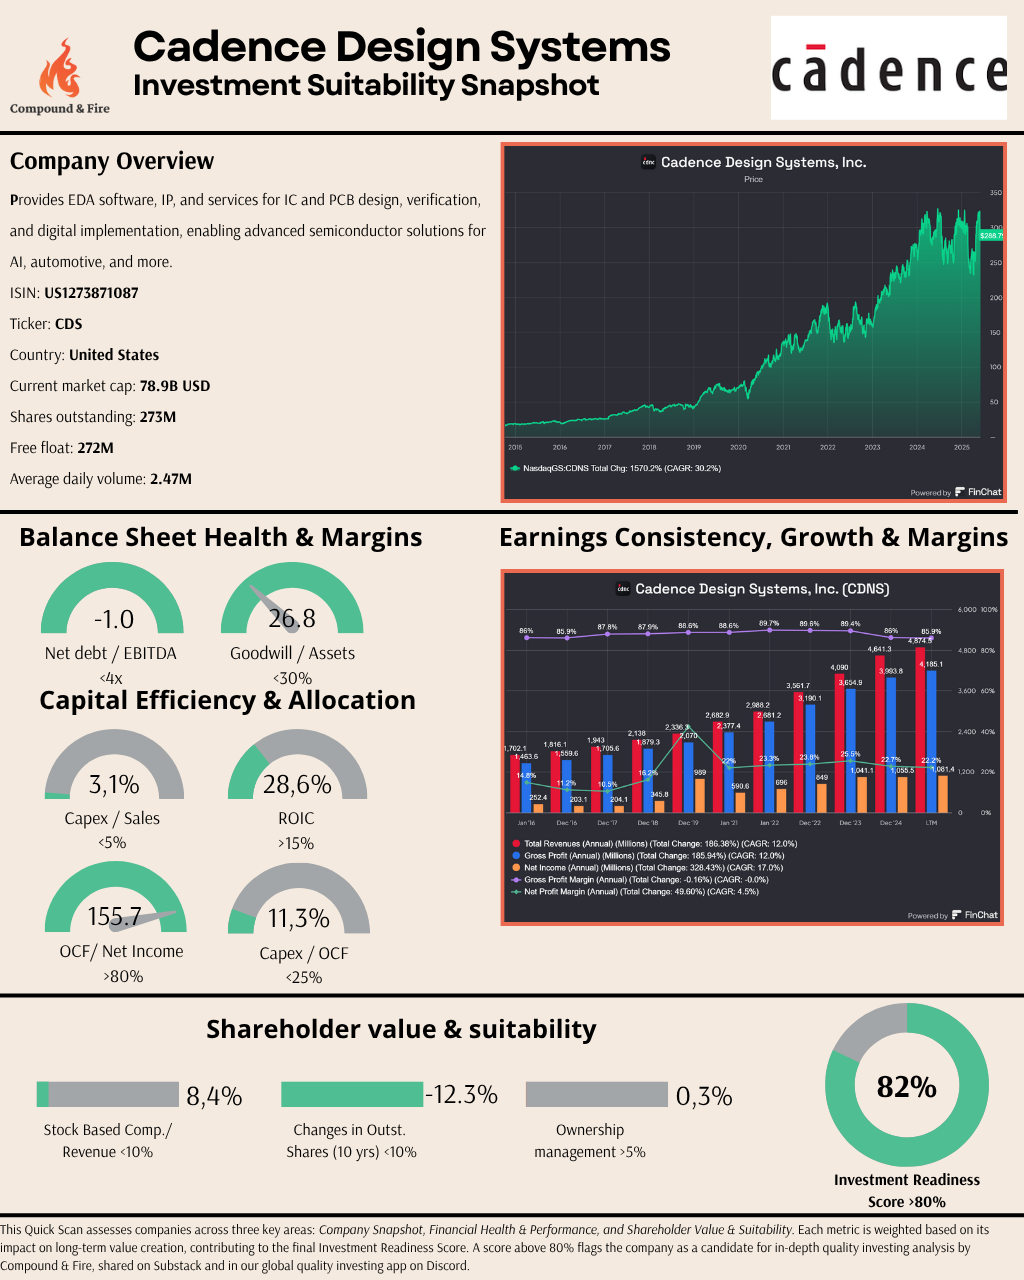
Cadence Design Systems is another EDA powerhouse, offering software, Intellectual Property, and services for IC and PCB design, verification, and digital implementation. Here’s how Cadence performed in my Quick Scan:
Investment Readiness Score: 82.0% - two percent above the threshold
Balance Sheet Health: Net Debt/EBITDA at -1.0x, also a net cash position.
Profitability: Gross margin at 89.2%, net margin at 23.7%—which are very sound margins.
ROIC: 28.6%, exceptional versus the 15% threshold.
Growth: Revenue 10-Year CAGR of 12.1%, outpacing Synopsys.
Stock-Based Compensation: 8.4%, which is moderate versus the 10% threshold.
This Quick Scan and the calculation of the IRS score is available in our Discord app
Cadence shines with a stellar ROIC of 28.6% and an impressive OCF/Net Income ratio of 155.7%, showcasing exceptional cash conversion. The company has aggressively reduced its share count by 12.3% over the past decade, signaling strong shareholder value creation. While management ownership is low at 0.3%, stock-based compensation is more reasonable at 8.4% of revenue. Cadence clears my 80% IRS hurdle with a score of 82%.
The Battle: Key Differences and the Winner
Both Synopsys and Cadence are formidable players in the EDA market, but my Quick Scan reveals critical differences that tip the scales in this battle.
Financial Health & Performance
Both companies boast healthy balance sheets with negative net debt (Synopsys: -2.2x, Cadence: -1.0x) and manageable goodwill levels. However, Cadence pulls ahead in capital efficiency and cash generation:
ROIC: Cadence’s 28.6% significantly outpaces Synopsys’ 19.3%, indicating better returns on invested capital.
OCF/Net Income: Cadence’s 155.7% ratio crushes Synopsys’ 111.6%, reflecting superior cash conversion. This means Cadence generates more cash per dollar of net income, a hallmark of high-quality earnings.
Shareholder Value & Suitability
While both companies have low management ownership (Synopsys: 0.6%, Cadence: 0.3%), Cadence demonstrates better alignment with shareholders:
Stock-Based Compensation: Synopsys’ 11.3% of revenue is a red flag, as it dilutes shareholder value more than Cadence’s 8.4%.
Share Repurchasing: Cadence has reduced its outstanding shares by 12.3% over the past decade, compared to Synopsys’ modest 1.15% reduction. This aggressive buyback program amplifies Cadence’s per-share value creation.
The Deciding Factor
Synopsys’ high stock-based compensation and lower ROIC and OCF/Net Income ratio put it at a disadvantage. While its financial health is solid, it falls short in delivering the same level of capital efficiency and shareholder value as Cadence. The result is clear in the Investment Readiness Scores: Synopsys scores 79.4%, just below my 80% threshold, while Cadence scores 82%, clearing the hurdle with room to spare.
Winner: Cadence Design Systems
What’s Next?
It’s important to note that this comparison is based on my Quick Scan, a high-level assessment designed to identify quality investment candidates.
Synopsys was on my watchlist but, with an IRS of 79.4%, it falls just shy of the mark. I have to draw a line, so Synopsys will be removed from the shortlist. On the other hand, Cadence Design Systems wasn’t on my radar but has now earned a spot with its 82% IRS.
I’ll be conducting a deep dive analysis on Cadence later on (there is a nice backlog of companies waiting already!), exploring its growth drivers, competitive moat, and long-term compounding potential. Stay tuned for the full report, which I always share on Substack and in our global quality investing app on Discord.
The EDA market is a battleground for innovation, and Cadence Design Systems has proven itself a worthy contender for quality investors. Until next time, keep compounding!
If you’re enjoying these Quick Scans, consider subscribing to Compound & Fire for more quality investing insights:
And feel free to share this article with friends:
Disclaimer
The information in this article is provided for informational and educational purposes only.
The information is not intended to be and does not constitute financial advice or any other advice, is general in nature, and is not specific to you. Before using this article’s information to make an investment decision, you should seek the advice of a qualified and registered securities professional and undertake your own due diligence.
None of the information in this article is intended as investment advice, as an offer or solicitation of an offer to buy or sell, or as a recommendation, endorsement, or sponsorship of any security, company, or fund. The author is not responsible for any investment decision made by you. You are responsible for your own investment research and investment decisions.