

The Trade Desk ($TTD): A Moat Master in Ad Tech or a Valuation Trap?
Exploring the $29.3B DSP Leader’s Growth, Risks, and 27% Overvaluation for Quality Investors.

Welcome to Compound & Fire! We search for businesses which create strong shareholder value over time in order to get financial independence and retire early.
This community is free, but if you’d like to support my time in providing deep analysis, you can Buy Me a Coffee. Every contribution helps keep this community thriving and is highly appreciated!
Join our global quality investing app on Discord here and join my Substack for free if you haven’t subscribed yet.
This is the first analysis I have made after a poll on the Compound & Fire Discord Community. With 45% of the votes the community decided for The Trade Desk. Do you also want to influence the analysis I am writing. Enjoy reading! Become part of the smartest Quality Investing Community on the planet.
General information
Name: The Trade Desk
Logo:
ISIN: US88339J1051
Ticker: TTD
Country: United States
Current market cap: 29.3B USD
Share price: 59.34 USD
Outstanding shares: 452.43 million (diluted shares outstanding: 501.9M)
Free float: 450.44 million
Average daily volume: 8.3M
About: The Trade Desk is a leading global demand-side platform (DSP) for programmatic digital advertising, enabling advertisers to buy ad space in real time across platforms like web, mobile, and connected TV (CTV). Founded in 2009, The Trade Desk is headquartered in Ventura, California, and operates in over 30 countries, with 3,700 employees as of early 2025. Its platform, powered by AI and data insights, serves brands and agencies worldwide.
Source: Q4 Earnings Presentation
Quick Scan
"Protecting your money is like guarding a castle: it's easier to keep invaders out than to reclaim lost territory.”
That is why I look for moat companies which protect my castle. I want to minimize the risk of losing money and maximize the chance a company is compounding. Compounding is like a snowball rolling downhill, getting bigger and faster as it goes, just as a company's profits grow faster when they reinvest their earnings into high-return projects, making even more money to reinvest again and again.
Balance sheet
A low Net debt / EBITDA ratio indicates that a company can repay its debt faster, potentially leading to better long-term shareholder return:
Net debt / EBITDA: 0 - net cash position (Net debt / EBITDA < 4x ✅)
A rule of thumb suggests that companies with a goodwill to assets ratio higher than 30% should be carefully analyzed to ensure the risk of potential write-offs is low:
Goodwill / Total assets: 0% (Goodwill / Total assets <30% ✅)
Impairments last 10 years: 0 (Impairments / Goodwill < 10% ✅)
This seems like a healthy balance sheet!
Cash Flow
“A business that doesn't take any capital and grows and has almost infinite Returns on required Equity capital is the ideal business” (Warren Buffett)
That is why I look for asset-light companies.
Capex / Sales: 4.0% (Capex / Sales <5% ✅). This even includes the purchase of Property, Plant and Equipment, which is for the majority growth capex instead of maintenance capex (which is good!).
Capex / Operating Cash Flow 13.3% (Capex / Operating Cash Flow <25% ✅)
Operating Cash Flow (OCF) / Net Income 188% (OCF / Net Income >80% ✅).
This is above 100% as a result of Stock-Based Compensation, which is not a cash out but impact the P&L.
The Trade Desk is a capital-light company, something I like to see as cash doesn’t have to be spend on maintenance capex but instead can be used for growth capex, M&A or share buybacks or dividend.
Capital Allocation
“Capital allocation is the CEO’s most important job” (Warren Buffett)
The metric which most often tells most about capital allocation is ROIC.
Return On Invested Capital (5YR average): 17.9% (ROE >15% ✅ )
Profitability
A high gross margin provides significant insights into a company's competitive advantage and potential for long-term shareholder returns.
Gross margin: 80.7% (Gross Margin >40% ✅)
Net margin: 16.1% (Net Margin >10% ✅)
Stock-Based Compensation (SBC)
95% of Restricted Stock Units (RSUs) are sold on vest, which potentially defeats the purpose of giving employees long-term skin in the game (Bill Gurley, a well-known venture capitalist).
Companies offering stock-based compensation plans can benefit shareholders through higher stock prices, but only if the level of dilution is not excessive.
Two different views, but opposite. In general I want to see the stock-based compensation below 5%, else it will dilute my stake in a company.
SBC to revenue: 20.2% (SBC < 5% ❌)
Change in Shares Outstanding 10 yrs: 12.9% (Change in Shares Outstanding <10% ❌)
These are typical Share based compensation figures for a tech company. I always find it difficult to accept as a shareholder that 20% of the revenue of a company goes to board and management ad shared based compensation. Not a good deal for shareholders. But I will take into account the SBC and expected increase in shares in my valuation.
Conclusion Quick-Scan
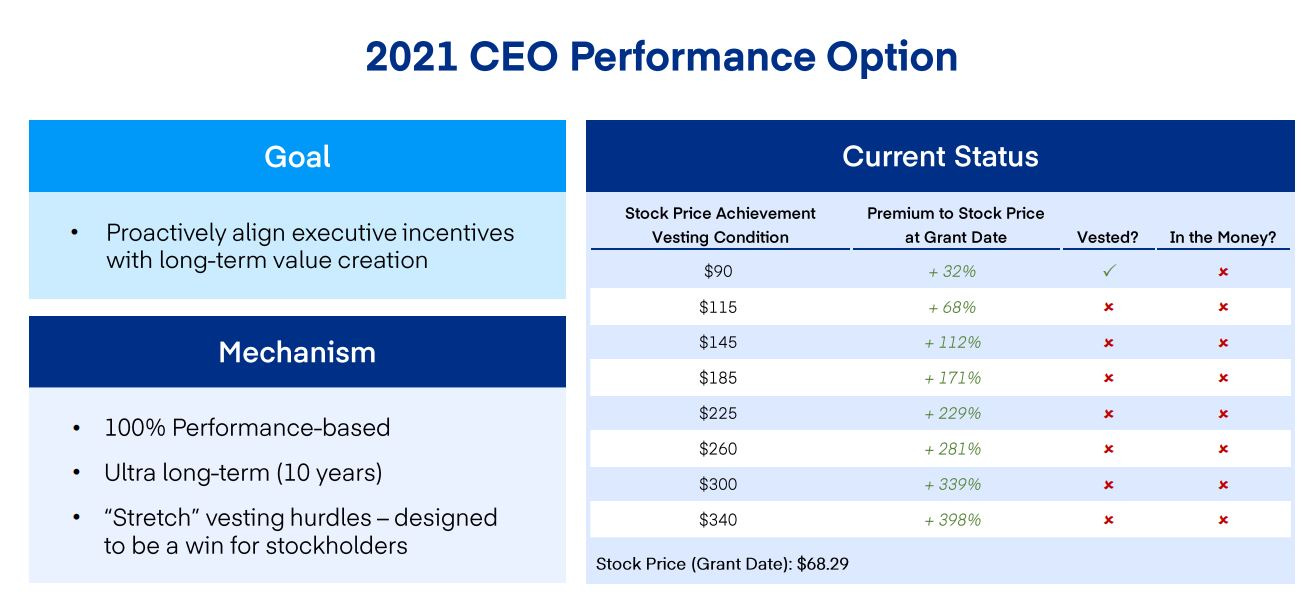
The quick scan shows an almost perfect score, till we reached the SBC paragraph. So far I unfortunately also didn’t read anything in their presentations about capital allocation and focus on return on investment, except for the executive compensation which appears to focus on the long-term. The CEO stock options are currently all out of the money. So at least his interests are aligned with shareholder interests.
Source: Stockholder Stewardship
Management
Jeff Green, The Trade Desk’s founder and CEO since 2009, leads with a vision to transform digital advertising through transparency and innovation. The leadership team includes CFO Laura Schenkein (since 2021), emphasizing financial discipline.
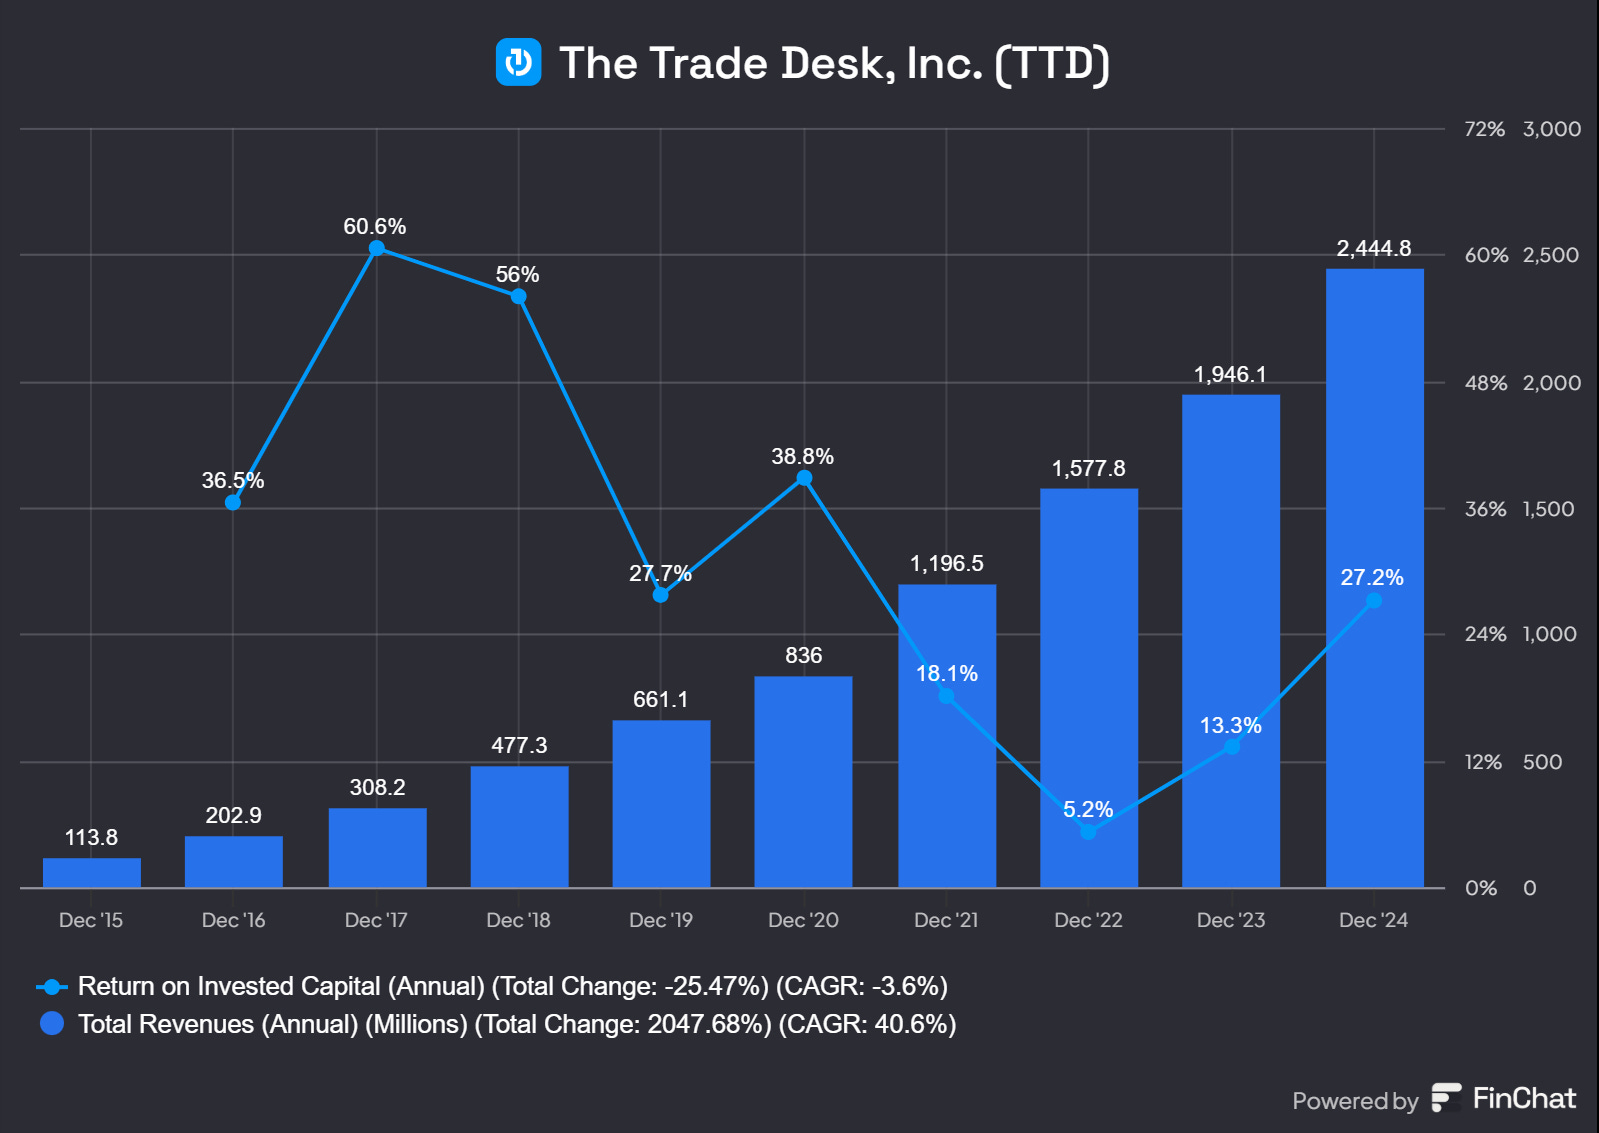
Leadership Track Record: Under Green, revenue grew from $661 million in 2019 to $2.1 billion in 2024, a 22% CAGR, with net income up 50% to $590 million in 2024.
CEO Ownership: Green owns 42.4 million shares, representing approximately 8.5% of the company’s 452 million outstanding shares. This significant stake signals strong alignment with shareholders and confidence in long-term growth.
Management Trustworthiness: The Trade Desk sets annual guidance for revenue and adjusted EBITDA growth. In 2022, they targeted 20-22% revenue growth and achieved 21%, meeting expectations. For 2023, they projected 18-20% and delivered 19%, also meeting targets. In 2024, guidance was 17-19%, and they achieved 18%, continuing a consistent track record. This reliability in meeting guidance suggests management sets realistic goals, fostering investor trust.
Before launching The Trade Desk in 2009, Jeff Green, its visionary founder and CEO, cut his teeth in the ad-tech world with an earlier venture that laid the groundwork for his later success.

Source: Investor Relations - The Trade Desk
In 2003, Green co-founded AdECN, a trailblazing company credited with creating the first online advertising exchange. Inspired by his time as a technical account manager at Microsoft’s MSN division, Green saw an opportunity to disrupt the opaque ad network landscape. AdECN brought a stock market-like model to digital advertising—a real-time marketplace that prioritized transparency and efficiency for buyers and sellers alike. It was a bold step that foreshadowed the programmatic revolution to come.
In August 2007, Green’s foresight paid off when Microsoft acquired AdECN. The deal, part of Microsoft’s broader push into online advertising alongside its $6 billion aQuantive acquisition, was a testament to AdECN’s innovative edge. While exact terms weren’t disclosed, estimates peg the sale at under $100 million—a modest but meaningful exit. Green stayed on briefly as COO of the AdECN Exchange, helping integrate it into Microsoft’s ecosystem and advising on its online strategy. By 2009, armed with invaluable experience and a clear vision, he left to co-found The Trade Desk with Dave Pickles, another Microsoft alum.
This chapter of Green’s story isn’t just a footnote—it’s a cornerstone of why The Trade Desk stands out as a quality investment. AdECN wasn’t just an early win; it was a proving ground where Green honed the insights and resilience that define The Trade Desk’s independent, data-driven approach today. From a scrappy startup to a platform powering billions in ad spend, Green’s journey reflects the kind of entrepreneurial DNA that long-term investors prize.
I recently tuned into The Current Podcast (here is the link if you are interested), where Jeff Green, the mastermind behind The Trade Desk, shared insights that underscore why this company is a standout in the quality investing universe. Green reflected on his journey, noting that unlike AdECN—his first venture, which he sold to Microsoft in 2007—he’s built The Trade Desk to last. “I don’t want to sell this one,” he said with conviction, signaling a long-term commitment that should resonate with investors who prize durability and purpose.
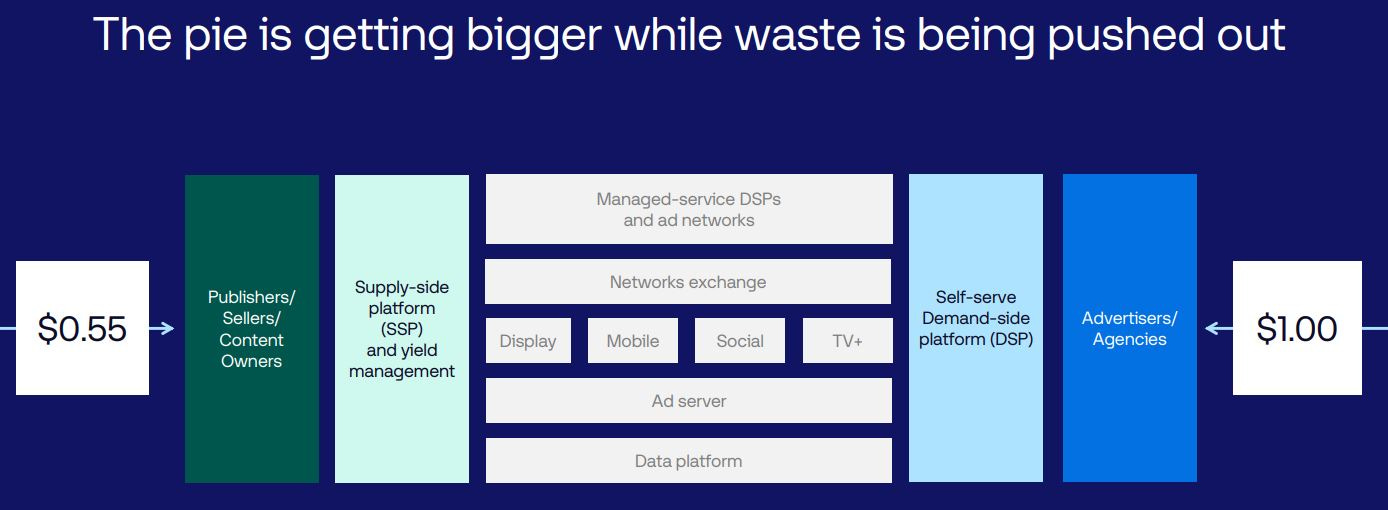
Green’s vision goes beyond just building a business; it’s about reengineering the digital advertising ecosystem for the better. He’s laser-focused on aligning interests across the board—advertisers, publishers, and consumers alike. In today’s landscape, content owners often come out on top, but Green insists advertisers win too, thanks to a market where supply outstrips demand. The Trade Desk acts as a central hub, empowering advertisers with transparency and tools to answer key questions: What’s an ad worth? How can it be optimized to transact more efficiently? How can it deliver more value? The result? Fewer, but smarter, more relevant ads—a boon for consumers who get a cleaner, less cluttered experience.
This isn’t just talk—it’s a win-win-win model in action. Advertisers gain precision, publishers secure better returns for premium content, and consumers enjoy a higher-quality internet. Green’s platform objectively surfaces the best content, leveling the playing field. He’s betting big on the open internet, predicting that premium content will increasingly flow there. His mission? To make that ecosystem more efficient, ensuring The Trade Desk isn’t just a middleman, but a catalyst for value creation.
For quality investors, this is the kind of leadership that matters: a founder who’s not in it for a quick exit, but to build something enduring that lifts all boats. The Trade Desk isn’t just playing the game—it’s rewriting the rules.
Market Attractiveness & Growth Potential
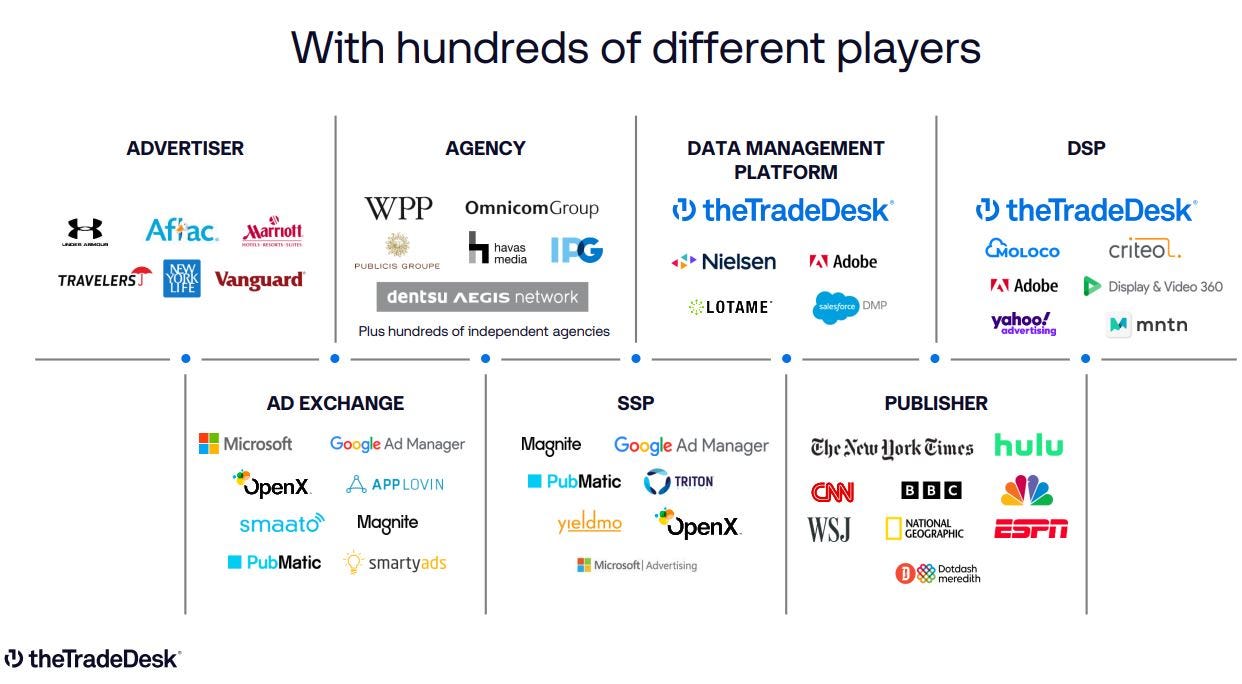
The Trade Desk sits at the heart of programmatic advertising—a dynamic, tech-driven corner of the digital ad world where buying and selling ad space happens in real time. Picture a stock exchange for ads: advertisers use demand-side platforms (DSPs) like The Trade Desk to bid on impressions across websites, apps, and Connected TV (CTV) screens, all powered by data and precision targeting. This isn’t about random banner ads; it’s a sophisticated machine reshaping how brands connect with consumers.
Source: Q4 Earnings Presentation
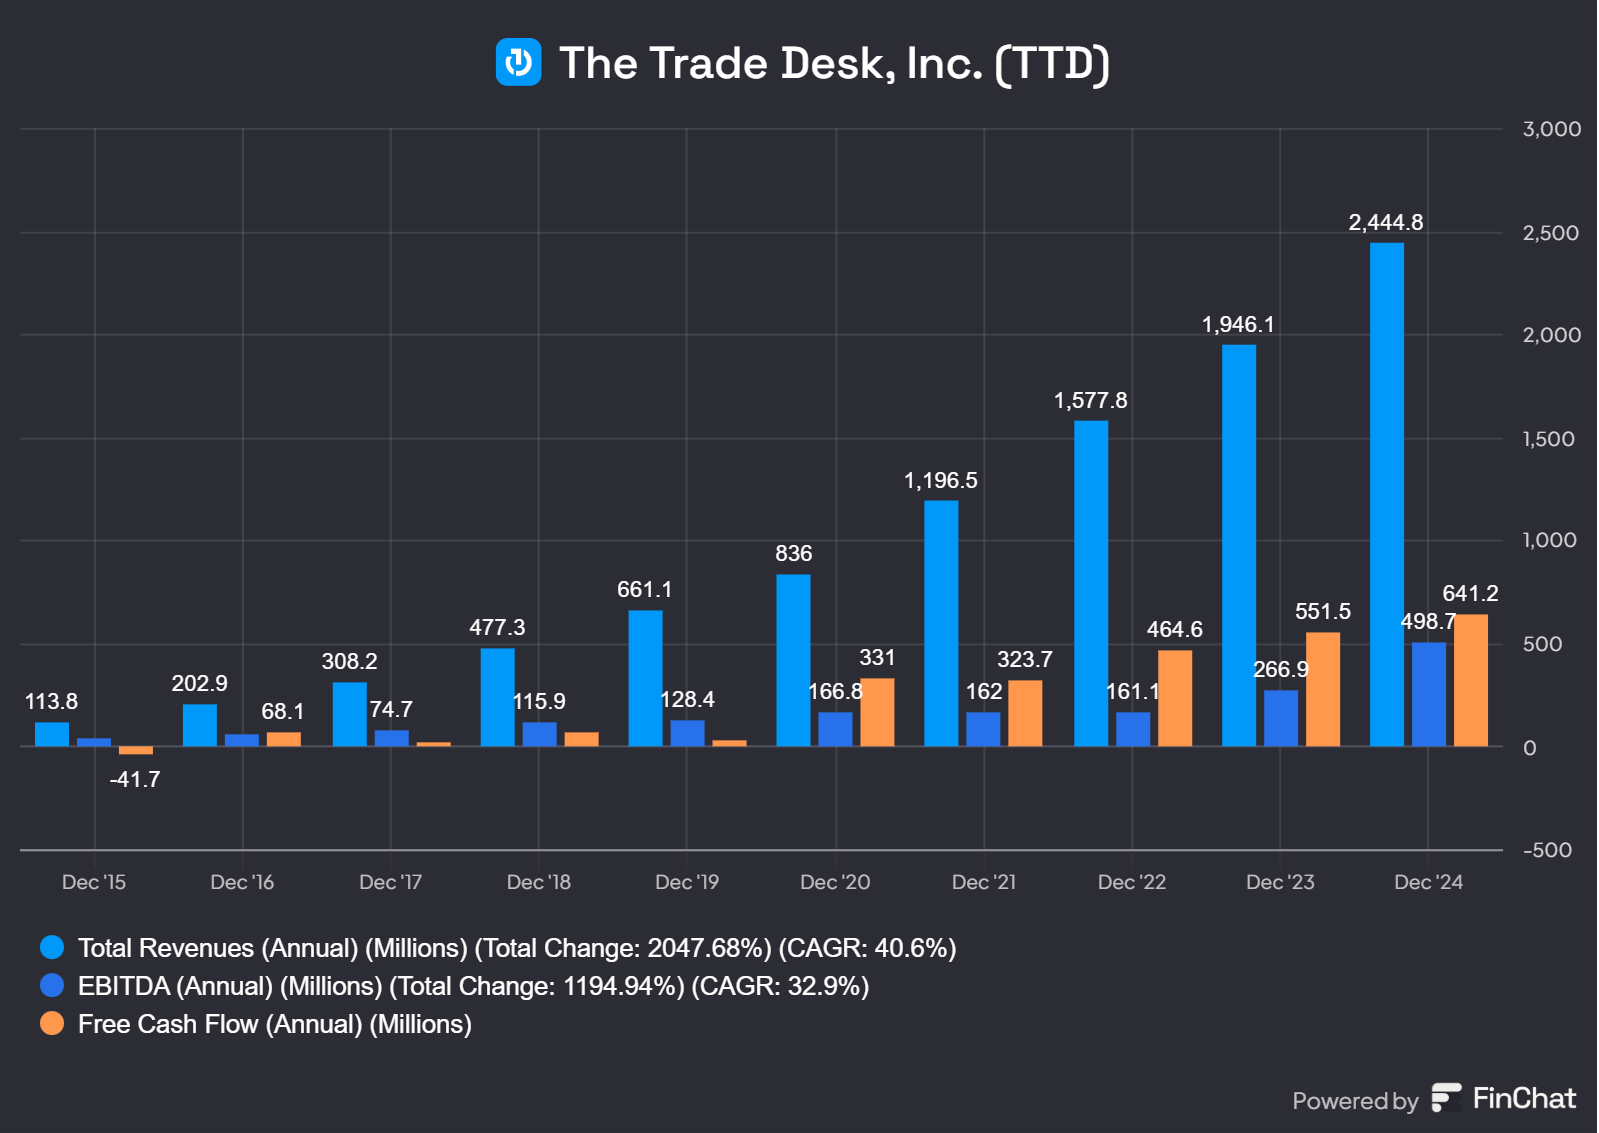
What makes this market so enticing? It’s growing fast—projected at a 12% CAGR through 2030, with global ad spend expected to hit $700 billion by 2027. The drivers are clear: CTV adoption is surging, data-driven targeting is getting sharper, and brands are shifting budgets from traditional media to digital channels. The Trade Desk holds a commanding 20% share among DSPs, trailing giants like Google’s DV360 (41%) and Amazon DSP (11%), but its focus on the open internet—beyond Big Tech’s walled gardens—sets it apart. From $45 million in revenue in 2013 to $2.4 billion in 2024, with $499 million in adjusted EBITDA, the company’s ascent mirrors the market’s hunger for programmatic solutions. That’s growth with profits—a combo quality investors crave.
The total addressable market (TAM) is barreling toward $1 trillion, per their investor deck, with CTV as the “largest and fastest-growing channel” ahead. Shopper marketing and international expansion are still early-stage goldmines, offering untapped upside. Key growth areas like CTV, the Kokai AI platform, and retail media partnerships underscore their edge, built on independence and transparency. They’re not just riding the wave—they’re steering it, delivering premium content to consumers while giving advertisers, diversified across major verticals, control.
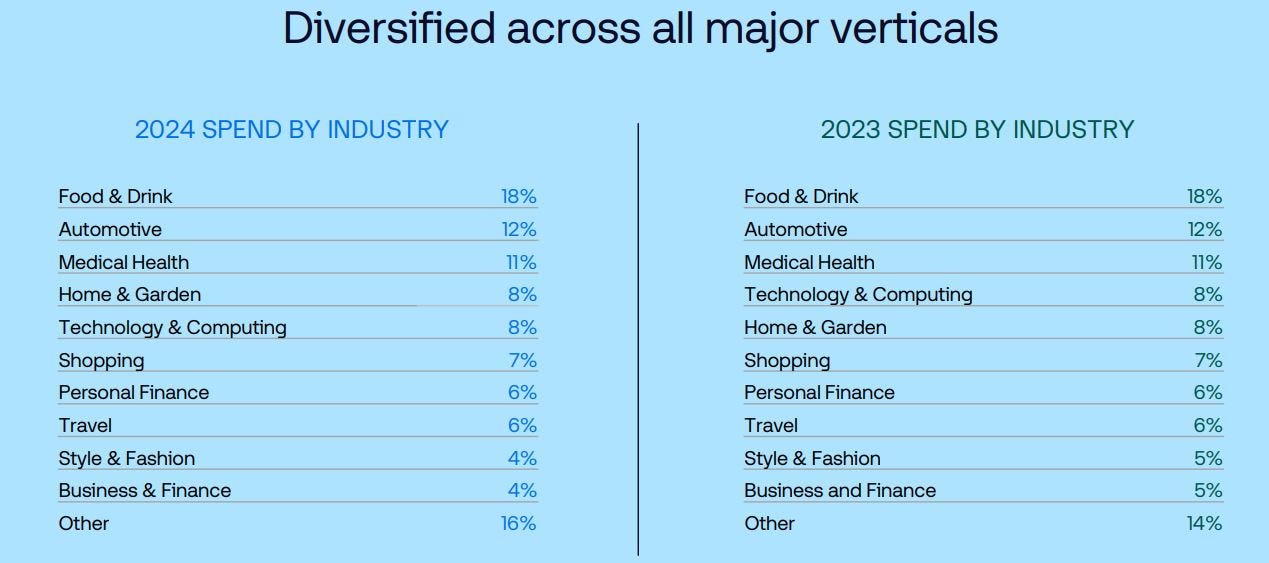
Source: Q4 Earnings Presentation
But it’s not all smooth sailing. Privacy regulations like GDPR and CCPA could tighten data use, and economic dips might slow ad spend. Yet, The Trade Desk adapts. Their retail data solutions are billed as future-proof, and their self-serve model drives operating leverage, cushioning against downturns. Here’s what stands out:
Market Size: A $700 billion ad spend target by 2027, with programmatic dominating digital channels.
Growth Drivers: CTV, data precision, and digital transformation fuel a 12% CAGR.
Financial Proof: Revenue up from $45 million (2013) to $2.4 billion (2024), paired with strong cash flow.
This is a market where scale, tech, and trust collide—and The Trade Desk is positioned to keep winning.
Strategy & Business model
The Trade Desk’s playbook is ambitious: hit $5 billion in revenue by 2027 (up from $2.1 billion in 2024), leaning on CTV (25% of 2025 revenue) and AI-driven tools like Koa (launched 2024). They’re a tech company laser-focused on helping advertisers buy ads efficiently across display, video, audio, and CTV. Partnerships with Disney, Comcast, and retailers like Walmart and Target, plus a 60/40 North America-to-international revenue split, fuel global scale.
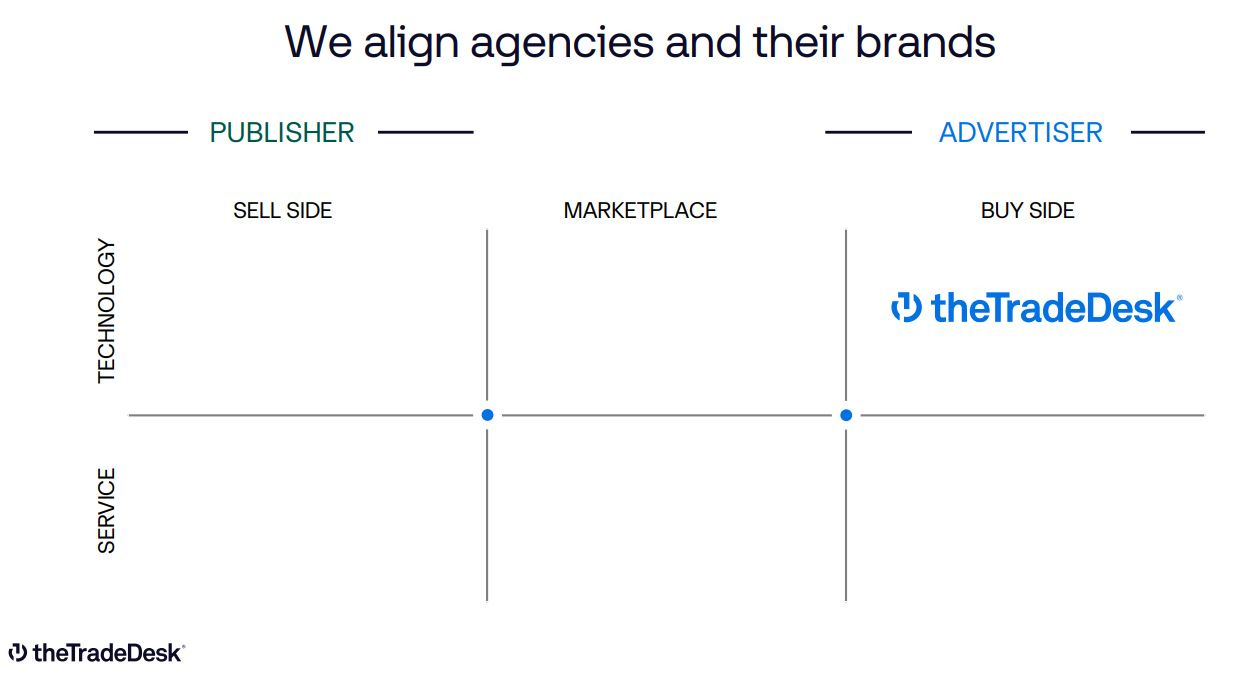
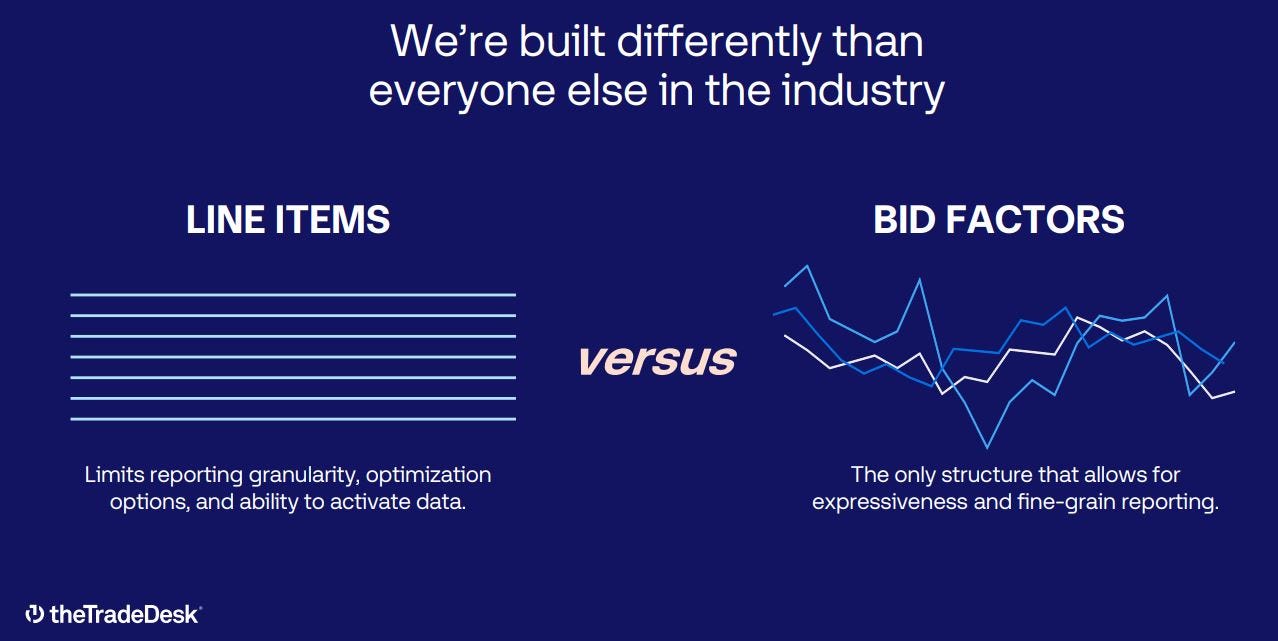
Their strategy rests on three pillars. First, data-driven precision: AI and real-time bidding (RTB) let advertisers target audiences with first- and third-party data, optimized by tools like Koa. Second, independence and transparency: They don’t own media, aligning solely with the buy-side—think clear reporting and client control, not publisher bias. Third, omnichannel reach: CTV, mobile, and audio expansion taps into streaming’s rise, bolstered by innovations like Unified ID 2.0 (UID2) for cookieless tracking.
Revenue flows from a 10-20% fee on ad spend processed through the platform—$605 million in Q4 2024 alone, up 22.3% year-over-year. It’s not a subscription, but with 95%+ customer retention, it feels like one: more client spend, more fees. Initiatives like OpenPath and UID2 don’t bill directly but boost platform value, driving higher usage. Growth hinges on:
CTV Leadership: Tools like TV Quality Index navigate the fragmented streaming market.
Retail Media: OpenPath and partnerships with Walmart unlock shopper data.
Revenue Model: $12 billion in platform spend (2024) reflects stickiness and scale.
The Q4 2024 earnings miss ($741 million vs. $756 million guidance) triggered “the largest reorganization in company history,” per CEO Jeff Green. Layoffs streamlined operations, reporting shifted to key accounts, and brand-direct deals (50% faster growth) took priority. Doubling down on CTV, retail media, and AI like Kokai aims to fix execution hiccups and hit that $5 billion target. It’s a bold pivot to stay ahead in a shifting ad-tech landscape.
Competitive Landscape
The DSP battlefield is fierce, and The Trade Desk squares off against heavyweights. Amazon DSP taps into Amazon’s ecosystem—300 million customer accounts, Prime Video, and Fire TV—making it a powerhouse for e-commerce-focused advertisers. Its first-party data is unmatched, and it’s gaining traction with non-endemic brands (think insurance or finance) thanks to sharper AI and lower acquisition costs. But outside Amazon’s walls, it’s less flexible, earning a 4.4-star Gartner rating (145 reviews) against The Trade Desk’s 4.6 (226 reviews).
Google’s DV360, with a 41% market grip, leverages YouTube, Google Maps, and advanced AI for unbeatable reach. Yet, its dual role as buyer and seller sparks transparency concerns—some advertisers crave alternatives to avoid Google’s dominance and cookie-phaseout pressures. Adobe Advertising Cloud, tied to Adobe’s Experience Cloud, targets enterprises with cross-channel tools but lacks The Trade Desk’s programmatic focus. Smaller players like Adform (Europe-strong) and Xandr (lagging at 2.6 stars) nibble at niches but can’t match the big three’s (Google, Amazon and The Trade Desk) scale.
The Trade Desk shines with independence—no inventory ownership means no conflicts, a big draw for advertisers wary of walled gardens. Its user-friendly interface and granular control earn raves, while Unified ID 2.0 positions it for a cookieless future. CTV leadership and consistent growth add muscle. Still, it’s not flawless: Google’s scale, Amazon’s data depth, and gripes about 20% fees (some call it the “new evil empire” on X) keep the pressure on. Here’s the rundown:
Strengths: Independent, customizable, CTV leader, Unified ID 2.0 adoption.
Weaknesses: Smaller scale (20% share), fee criticism, reliance on third-party data.
Strategic moves like OpenPath (direct publisher links since 2022) cut costs but irk supply-side partners. Amazon’s push into non-endemic ads and Google’s AI prowess loom large. The Trade Desk estimates it holds just 2% of the TAM, hinting at a long runway—if it can fend off the giants.
Source: Q4 Earnings Presentation
Risks
The Trade Desk’s rise in the programmatic ad world is impressive, but even a castle with a wide moat can face sieges. Its business model—scalable and tech-savvy—has vulnerabilities that could trip up its growth or rattle investors. Let’s dig into the risks below.
Talent Retention and Stock-Based Compensation Fallout: That 20.2% of revenue tied to stock-based compensation (SBC) isn’t just a shareholder dilution headache—it’s a double-edged sword. If the stock price stagnates or drops (like the 27% plunge after Q4 2024’s miss), those Restricted Stock Units (RSUs) lose their luster for employees. Tech talent is fickle; a weaker equity incentive could spark an exodus to rivals like Google or Amazon, who can dangle bigger carrots. The risk? Losing the brain trust that powers their AI and platform edge.
Key-Person Dependency: Jeff Green’s vision has been the North Star since 2009, from AdECN to today. His 8.5% ownership and track record scream alignment, but what happens if he steps back? No clear successor has emerged, and his outsized influence—strategic and cultural—leaves a gap. Quality investors love founder-led firms, but the flip side is a potential leadership vacuum that could stall momentum.
Regulatory Wildcards Beyond Privacy: We’ve touched on GDPR and CCPA, but broader regulatory shifts loom. Antitrust scrutiny of ad-tech giants could spill over, especially if governments eye The Trade Desk’s 20% DSP share or its fee structure as anti-competitive. A crackdown on real-time bidding practices—core to their model—could force a costly pivot. Imagine a world where regulators cap DSP fees or mandate open access to data; it’s not sci-fi, and it could dent margins fast.
Client Concentration Risk: With 95%+ retention, The Trade Desk’s client base is sticky, but what if a few big fish dominate? Their filings don’t break out customer concentration, but in ad tech, losing a top-tier agency or brand (think a P&G or Unilever) to a rival DSP could sting more than expected. Joint business plans with brands are accelerating, but over-reliance on a handful of heavy hitters could backfire if relationships sour.
Tech Debt and Innovation Lag: The Kokai AI and Ventura OS sound cutting-edge, but scaling a $12 billion platform means juggling legacy systems too. If tech debt piles up—think outdated code or clunky integrations—they might lag behind a nimbler upstart or a Google doubling down on AI. Continuous R&D spend is a must, but missteps in prioritizing innovation (say, over-investing in CTV at audio’s expense) could leave gaps competitors exploit.
Here’s the shortlist of what keeps me up at night:
Macro Shocks: A global trade war or inflation spike could slash ad budgets beyond a typical recession, hitting their fee-driven model hard.
Cybersecurity Threats: A data breach or platform hack could torch trust with advertisers and publishers overnight.
Fee Backlash: If clients push back on that 10-20% cut enough to force a rate cut, profitability takes a hit.
The Q4 2024 restructuring tackled execution hiccups, but these broader risks loom larger. The Trade Desk’s $2.4 billion revenue and 95% retention prove resilience, yet no moat is unbreachable. Execution in 2025 will be key—stumble here, and these shadows could darken the outlook.
Valuation
In order to have an understanding of the valuation of the company it is good to look from multiple angles.
Reverse DCF
Starting with known data points and working backwards to assess market expectations and judge whether these expectations are realistic.
Let’s first have a look at the reverse DCF.
To start with, it is very important for a tech company to consider the Share Based Compensation (SBC), especially as this was showing a red flag at the Quick Scan. My approach to deal with the share based compensation is to use the fully diluted share count (including vested options, RSUs, and in-the-money unvested options) in my calculation. Note: as the stock price dropped, there are unvested out-of-the-money options, which could result in around 10M more shares when the stock price increases. Those 10M are not considered in my Reverse DCF.
Next it’s important to calculate the unlevered free cash flow, but in the case of The Trade Desk I have to make an adjustment. According to the book of Adam Seessel “Where the money is” you have to capitalize a portion of R&D—treating it as an asset you amortize over time (I will take 5 years)—then adding back the non-cash amortization to cash flow. This boosts UFCF in early years, reflecting that not all R&D is “lost” cash but a bet on tomorrow’s revenue. For The Trade Desk, with R&D driving CTV and AI leadership, this makes sense conceptually. Given their innovation focus (higher than a mature firm like Microsoft) for The Trade Desk 60% growth R&D feels right (versus 40% maintenance R&D). R&D expenses aren’t just about inventing shiny new things—they also cover the ongoing work needed to keep existing systems running, compliant, and competitive. So that’s the 40% I will assume and the 60% is the adjustment I have made to my model. To be completely transparent, here is the forecast:
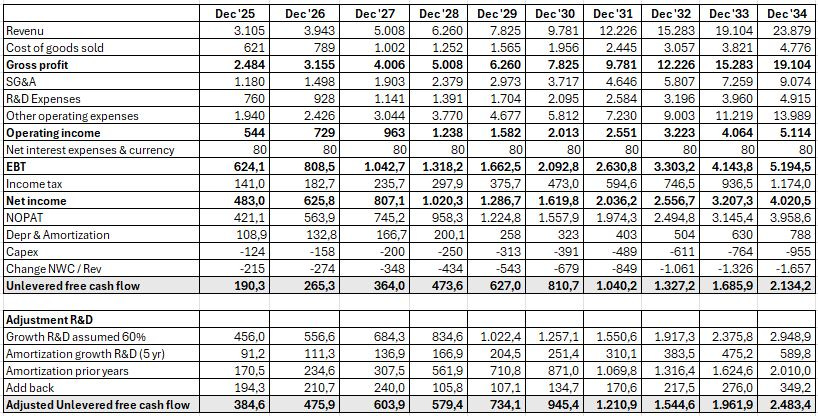
As you can see, I have aligned to management expectations with a revenue of 5B in 2027, followed by an annual 25% increase after 2027. The adjusted unlevered free cash flow is 384.6 for year 1 (2025) and that is my starting point.
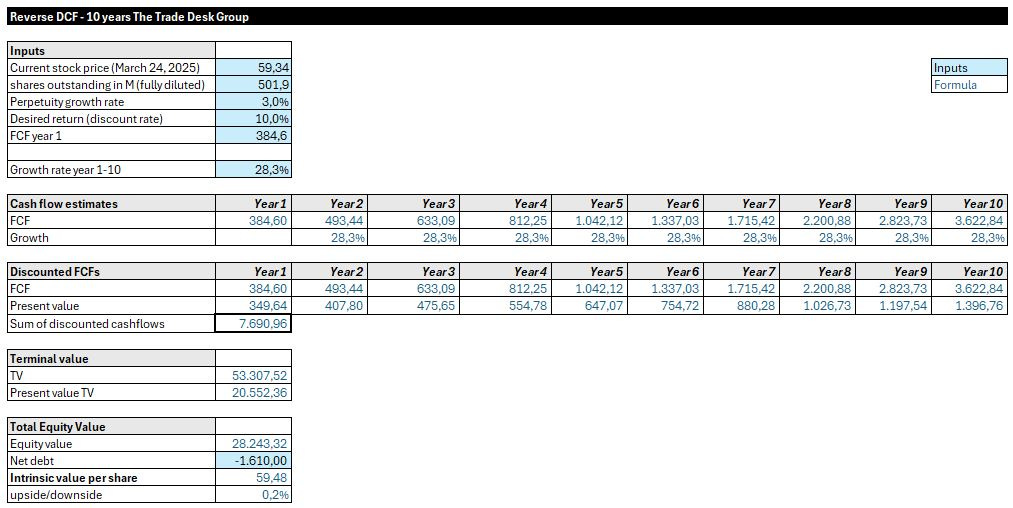
The reverse DCF is showing that at the current price (March 24, 2025) a growth rate for the next 10 years of 28.3% is calculated to get a 10% annual return on your investment. When I take the CAGR of my forecast for the unlevered free cash flow, I come at 23.0%. So it feels like the current share price is too rich, even after the significant drop.
What are the main items I will be looking for in the next updates of The Trade Desk:
Revenue growth, does it match my model?
SG&A and SBC: I have calculated with 38% of revenue, as per Q4. TTD announced a restructuring, laying off employees, but they also want to increase C-level and management functions. I have forecasted this will offset, but it’s one to watch closely. On top: as I take the approach to calculate with fully diluted shares I am not adding back Share Based Compensation (SBC). Note: this is a conservative approach and includes a margin of safety. If TTD will lower their SBC, which is part of SG&A expenses, in future years, then this would lower the SG&A percentage as well.
R&D Expenses: TTD announced to double down investments on AI. I have taken 20% of revenue as R&D costs plus 139M, assuming around half of growth R&D expenses is AI related and will be doubled, keeping the additional 139M flat in the years after.
Based on the conservative Reverse DCF the growth baked into the current stock price seems sporty. Now let’s have a look at the DCF-model.
DCF-model
For the DCF I will take the same assumptions and in this case take the CAGR of the unlevered free cash flow of 23.0%:
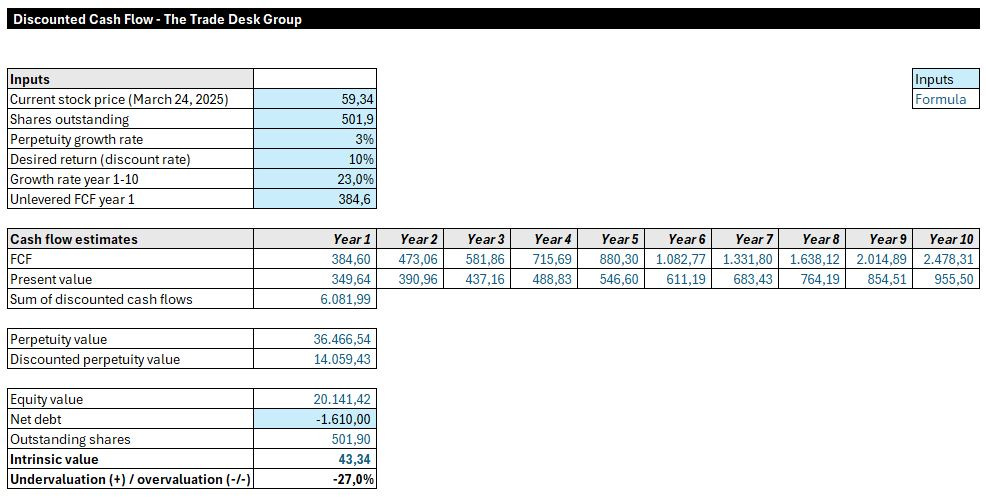
The outcome is a conservative intrinsic value of 43.34 which is an overvaluation of 27% to today’s stock market price.
Forward P/E
The average Forward P/E last years was 52.7 versus a forward P/E of 32.98 today. Personally I think the Reverse DCF and DCF are of more value, versus looking at the historical average forwrd P/E versus today’s level. Especially as the revenue growth in the past has been much higher versus the last two years.

Final Conclusion
The Trade Desk offers a compelling story for quality investors, blending a wide moat, visionary leadership, and a booming market—but it’s not without its challenges. Here’s a 10-point summary of the deep dive, followed by why you might (or might not) invest at today’s price:
Moat and Financial Health: The Trade Desk boasts a pristine balance sheet (net cash, 0% goodwill) and an asset-light model (Capex/Sales 4%, OCF/Net Income 188%), with a stellar 80.7% gross margin and 16.1% net margin, signaling a strong competitive advantage in programmatic advertising.
Growth Trajectory: Revenue soared from $45M (2013) to $2.4B (2024), with a $5B target by 2027 (27% CAGR), driven by a $1T TAM, CTV’s rise, and a 12% CAGR in programmatic ad spend through 2030.
Leadership Strength: Founder-CEO Jeff Green (8.5% ownership) brings proven vision—AdECN’s success and a 22% revenue CAGR (2019-2024)—with a “build to last” mindset, consistently hitting guidance until a Q4 2024 miss.
Market Position: Holding a 20% DSP share, The Trade Desk leads with independence, transparency, and a 4.6-star Gartner rating, outshining Amazon DSP (4.4 stars) and trailing only Google’s DV360 (41% share) in scale.
Strategic Focus: Their playbook—data-driven precision, omnichannel reach (CTV at 25% of 2025 revenue), and innovations like UID2—positions them to capture the open internet’s growth, with 95%+ retention and $12B in platform spend.
Competitive Risks: Google’s scale, Amazon’s data depth, and fee criticism (20% of ad spend) pose threats, while OpenPath’s cost-cutting move strains supply-side ties.
Operational Risks: High SBC (20.2% of revenue) risks talent retention if the stock lags, and key-person dependency on Green (no clear successor) could disrupt momentum.
External Risks: Regulatory shifts (antitrust, fee caps), client concentration, and tech debt could hinder growth, while macro shocks or cybersecurity breaches might erode trust.
Valuation Concerns: The Reverse DCF implies a 28.3% UFCF growth rate for a 10% return at $54.25/share, above the forecasted 23% CAGR, suggesting the stock is richly priced; the DCF yields $43.34/share (27% overvaluation based on a conservative calculated DCF).
Upside Potential: R&D adjustments (60% growth, 5-year amortization) and operating leverage (SG&A to revenue dropping more than 38%) could boost UFCF, but SBC dilution and execution risks temper optimism.
The Trade Desk is a quality compounder—its moat, growth runway, and leadership make it a long-term winner. If revenue hits $5B by 2027 and SG&A/SBC trends improve, the stock could deliver 10%+ annual returns, especially if bought on a dip (e.g., closer to $41/share). Their focus on the open internet, CTV leadership, and 95% retention scream durability for patient investors.
However, at $54.25, the valuation demands near-perfect execution—28.3% UFCF growth is steep versus a 23% forecast. High SBC (20.2% of revenue), a Q4 2024 miss, and risks like regulatory scrutiny or key-person dependency add uncertainty. Quality investors might wait for a better margin of safety, as the current price leaves little room for error.
For now I will stay at the sidelines. Let me know your thoughts and whether you agree or disagree with my conclusion and forecasts assumptions!
Join our free global quality investing app on Discord here to discuss further and subscribe to my free Substack if you are not a member yet.
Hopefully you have enjoyed this deep dive. This analysis is free, but if you’d like to support my time in providing such analysis, you can Buy Me a Coffee. Feel free to like the post and share it with friends!
Disclaimer
The information in this article is provided for informational and educational purposes only.
The information is not intended to be and does not constitute financial advice or any other advice, is general in nature, and is not specific to you. Before using this article’s information to make an investment decision, you should seek the advice of a qualified and registered securities professional and undertake your own due diligence.
None of the information in this article is intended as investment advice, as an offer or solicitation of an offer to buy or sell, or as a recommendation, endorsement, or sponsorship of any security, company, or fund. The author is not responsible for any investment decision made by you. You are responsible for your own investment research and investment decisions.
Balanced, fair article thank you. I am long at 49 love this co. just for disclosure.
1- On SBC: Agree 20% is high for the average stock but avg cloud/software stock has 20% or more SBC so rather avg. for its sector and has trended down since a peak at 40% yrs ago. I am okay with it because the $1B buyback pgm mainly offsets dilution. Since cash flow growing annual buy backs seem in the cards now. Were you were aware of this at publication or perhaps you do not value its offset of SBC as much as I may?
2- On international, unless we are using different semantics the highest INTL % is 15-20% but last checked it was at 12-15% and this needle has not moved much since co. inception. CEO has been firm that the potential in USA alone is so big and profitable he won't lose focus here by spreading too thin. That being said Netflix is hitting stride and launching its ad-tier this year in EMEA so it will be material to $TTD in 2025 2H into 2026. My estimates are for it to add ~2% of revs 2025 and up to 12% in 2027. Also signed with some key Asian CTV providers as well. I was CMO of a large intl co. and USA was 40-50% of TAM and easy to attack as ad spend very centralized inside US and controlled to rest of world. Rest of world super fragmented so viscosity, effort, resources to get one $ in ad spend was 50X harder to capture.
So I see INTL purely as a cherry on top or an insurance plan in case US has some slowdown or other unforeseen issue they have the bases covered to turn it on. Your article definitely made me consider some new things. CEO risk is always a risk but in this case much more than usual so kudos for raising it. Jeff G. is THE digital guru and visionary of digital ads so we can count on him to never be caught off guard by anyone or anything but this is why it is also a risk. Thanks again and big respect.
John D.
Thanks. Well done.
1. What about the Ventura project? It's been three years in making? Isn't that important to be detailed in the report or there is insufficient details? I have just finished listening to the podcast (thank you) and ~ half of it is discussion around Ventura.
2. IMHO, management incentives (KPIs) are missing. Skin in the game is covered, although, I don't know how much of the 8.5% are options/grants that have vested (therefore at no cost to JG) and how much is public market buying (if any).